
Contract Manufacturing: Descriptions For A Decade Of Growth

By Louis Garguilo, Chief Editor, Outsourced Pharma

A recently released study estimates that over the next 10 years, global biopharma contract manufacturing (combined small and large molecule) will grow globally at an annualized 4.8% rate.
Roots Analysis, a market research and consulting firm for the pharmaceutical industry, says that growth will add to the estimated “current global contract pharmaceutical installed manufacturing capacity of 125 million liters [30.4 million U.S. gallons].”
The report, “Pharmaceutical Contract Manufacturing Market (2nd Edition), 2018-2028,” estimates North America holds the largest share (34.3%) in the overall contract manufacturing market. This is followed by Asia-Pacific and Europe, accounting for shares of 34.0% and 30.4%, respectively.
Asia-Pacific is expected to grow at a significantly higher annualized growth rate (7.1%) than Europe or North America (the latter anticipated to expand at CAGR of 2.9%). That’s because of “inherent advantages, such as relatively low labor costs and less stringent regulatory constraints.”
Interestingly, this last bit of reasoning behind the growth in Asia-Pacific is somewhat inconsistent with what we’ve heard firsthand at Outsourced Pharma from drug sponsors over the past 18 months.
They’ve told us rising prices for services in the AP region, and quality and reliability issues attributed to less attention to rigorous regulation and oversight, are deterrents to the increased selection of AP-based CMOs. In fact, the Roots report does touch on some of these concerns as well.
This report is chock-full of the quantifying we rarely find in our field of drug development and manufacturing outsourcing. The stats and analysis should help us to understand where we stand today and, I suspect, reinforce most of our thinking on where we are going on a quantifiable level. There’s also some fundamental but interesting categorization we’ll take up.
Paint By Numbers
In terms of active pharmaceutical ingredient, generic APIs hold the major share of the total outsourced market (84%). The remaining share (16%) is occupied by branded APIs. We can expect the gap to widen even further.
Specifically within the contract finished dosage forms (FDF) market, solid dose compounds (around 50%) dominate, followed by injectables (33%), and semi-solid/liquid compounds (17%). Future growth is likely to be driven by injectables dose manufacturing, “primarily due to increased focus on complex disease areas, and the growing trend of self-administration.” The most popular types of FDF are primary packaging of tablets/capsules/blisters, currently holding 26% of the total FDF contract manufacturing market. This is followed by glass/plastic/dropper bottles (21%) and vials/cartridge (15%).
The report iterates what Outsourced Pharma readers have known for years: Contract development and manufacturing has evolved from a second-supplier and purer-play cost-reducer mentality [my description], to “a high-value segment of the overall pharmaceutical industry.” The report counts over 150 completely new CMO entrants to the industry since 2000, offering “a variety of cost-efficient solutions” to the pharmaceutical industry.
There are now over 300 CMOs that have obtained “operational approvals and other necessary certifications” from the FDA. This is followed by CMOs certified to operate in accordance to the standards established by the European Medicines Agency (140), World Health Organization (126), and UK Medicines and Healthcare Products Regulatory Agency (87), in Europe. In Japan, facility approvals by PMDA (MHLW) stand at 75, and in China, approvals by CFDA (MFDS) are 57.
Overall, the report identified more than 500 CMOs, featuring a mix of established companies (>200 employees, 52%), mid-sized companies (>50 employees, 27%) and small-sized companies (<50 employees, 21%), all offering contract manufacturing services at various scales of operation.
To be clear, then, given the numbers in the preceding paragraphs, we are looking at a sizable number of CMOs with multiple international approvals. Here, too, we can expect more of the same, as a global wave of M&A and other consolidation continues.
For a final statistic before moving to an interesting categorization of CMOs, the Roots report says “presently, 46% of CMOs are dedicated to providing FDF manufacturing services, while 23% specifically offer API manufacturing services. The remaining (31%) companies offer contract manufacturing services for both API and FDF.”
Bets are on that third category continuing to grow.
Concise CMO Categories
How we define impacts how we think. To reimagine a market or industry, circling back to fundamental definitions can be a good place to start. So while there won’t be epistemic revelations with the way the Roots report defines CMOs, I think you’ll agree these categorizations can induce some renewed reflection on the relationships and strategies for the outsourcing of your drug manufacturing.
Here’s the chart that first caught my eye when going through this report. Below the chart, I’ve abridged the accompanying definitions/categorizations.
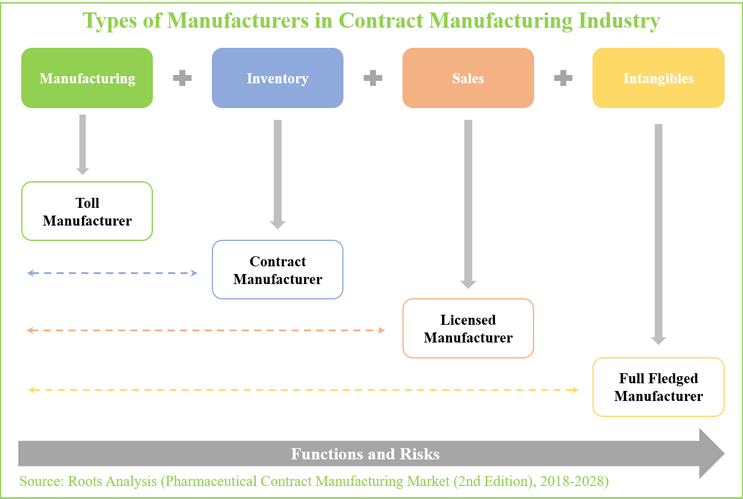
1. Toll manufacturers provide customers with a facility or manufacturing equipment to process their raw materials (or semi-finished products) at industry scale, for a fixed fee. For this purpose, both parties enter into an exclusive licensing agreement, under which the drug sponsor provides the materials and goods required for manufacturing to the toll partner (CMO). As part of the agreement, the customer receives ownership of all intangible assets associated with the outsourced products, primarily the patents and designs related to a product.
2. Contract manufacturers – like toll manufacturers – are third-party organizations that offer services on a contract basis [including fee-for service, FTE, milestone-based, etc.] In addition to offering a variety of services, a contract manufacturer is also responsible for the raw materials required for the manufacturing process (unlike toll manufacturers).
3. Licensed manufacturers offer production services under relatively long-term, product license agreements. This is usually done by leveraging the intangible assets (patent, product designs, manufacturing process, and others) owned by customers. In return, the manufacturer pays an annual royalty (for the intangibles) and is responsible for the sourcing of raw materials and semi-assembled goods. Further, the licensed manufacturer is expected to bear all the risks associated with holding inventories and selling the manufactured products.
4. Full-fledged manufacturers undertake all the above-mentioned activities. These organizations generally offer the required working environment, industrial-grade equipment, and the required labor force to cater to all the demands of their customers. In addition, they provide all the raw materials and goods necessary for product manufacturing. Such manufacturing firms are also equipped to provide assistance in significant R&D activities, and generally bear all the risks associated with the sales of products, as well. However, such players generally hold all the rights to the intangible assets (patents, designs, manufacturing process and others) that belong to the customer.
Allow me to note that today, nary a “CMO” of any categorization doesn’t include development capabilities, and most can also be described with the interchangeable “CDMO” moniker.
So how much outsourcing are we doing as an industry and individual organizations, who are we doing it with, and why? The “Pharmaceutical Contract Manufacturing Market (2nd Edition), 2018-2028” helps us better answer those questions.