
Using Digital Shadows To Reinforce Downstream Modeling
By Daniel Espinoza, Ph.D., Lund University

Mathematical modeling of biopharmaceutical manufacturing is a powerful tool when designing optimal processes that maximize product recovery while minimizing resource utilization. However, the realization of an accurate mathematical model requires time, effort, and a broad scope of knowledge from the development engineer.
In a previous article, I highlighted the use of a Python-based piece of software, called Orbit, to combine the workflow of setting up and controlling a chromatography system for biopharmaceutical purification, with the formulation of a mathematical model of the system. This allowed us to automate the modeling efforts and streamline the process of obtaining a digital twin of a downstream processing system.
In this article, I will demonstrate how such a digital twin can be used beyond offline optimization. In particular, I will show how it can be used in real time in conjunction with online process analytical technology to enhance process monitoring. But before I dive into the specifics of our case study, a discussion on the definition of a digital twin is in order.
Classification Of Digital Twins
Digital twins are a popular subject and thus it is easy to confound the meaning of the term as it is used in many different contexts. To address this, I would like to highlight a publication by Kritzinger et al. (2018) titled Digital Twin in Manufacturing: A Categorical Literature Review and Classification.
In this paper, a digital twin is defined as a digital representation of a physical object. A classification system for digital twins is proposed based on the implementation of real-time data transfer between the digital and physical objects. For instance, in the example from my previous article, a manual transfer of information occurs from the physical object (the chromatography system) to the digital object at one point in time: the components of the chromatography system, the length of tubing, and the connectivity of the components are fed into the digital object, resulting in a set of mathematical equations that represent the physical object.
At a separate point in time, data obtained from automated experiments are transferred to the digital object to allow for calibration of the mathematical model. Once calibrated, the model is used to provide an optimal operating point for the system: information from the digital object is transferred to the physical. When information is transferred in an offline and/or manual manner between the physical and digital objects, such as in the above example, the classification system proposed by Kritzinger et al. refers to the digital twin as a digital model.
The natural definition of the next class of digital twin is when there is real-time, automated transfer of information between the physical and the digital objects in one direction but not in the other. This class of digital twin is referred to as a digital shadow. Naturally, the final class of digital twin involves real-time, automated flow of information in both directions, and that can be referred to as a fully realized digital twin. This classification framework is summarized in Figure 1.
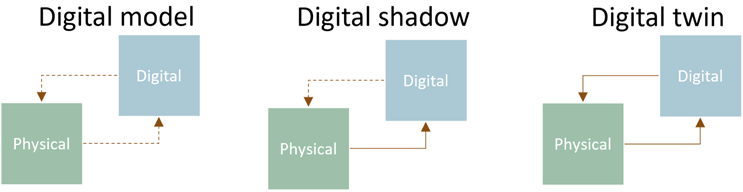
Figure 1: This digital twin classification framework is proposed by Kritzinger et al. (2018). The three classes are distinguished by the flow of information between physical and digital objects. When there is one-time, offline, and/or manual flow of information in both directions (dashed lines), the digital twin is classified as a digital model. As information flow is automated and implemented in real time (solid lines), different classifications are obtained, culminating in the fully realized digital twin, where the information flow is automated and in real time in both directions.
This framework is helpful in distinguishing between the utility of different digital twin implementations. A classic use of digital twins in downstream processing of biopharmaceuticals is designing an optimal purification based on a set of decision variables, which would fall under the digital model category. For the remainder of this article, I will showcase the implementation of a digital shadow based on the previously discussed digital model.
Case Study Illustrates Digital Shadows’ Advantages, Limitations
To showcase the usefulness of a digital shadow for real-time monitoring, I would like to describe the advantages of a mechanistic digital model over real-time process analytical technology, such as UV absorbance measurements, as well as its disadvantages.
In Figure 2, a process chromatogram shows two components being separated by means of linear gradient ion exchange chromatography. The estimated UV signal (solid blue line in the top graph) overlaps fairly well with the UV signal measured in real time (blue triangles).
Only one peak is visible in the UV measurement but, in reality, two components are present: cytochrome C (red) and lysozyme (light blue). The digital model distinguishes between the two, while a single-wavelength UV measurement cannot make the distinction. However, when looking at the simulated concentrations rather than the simulated UV (middle graph), one can see that the model (dash-dotted lines) diverges from the values obtained from offline analysis (solid lines). The model was still useful for process design, but it lacks some accuracy.
To summarize, UV measurements are a reflection of the “true” events occurring in the process, but they lack the ability to distinguish between separate components. The digital model can do the latter, but it has shortcomings in accuracy.
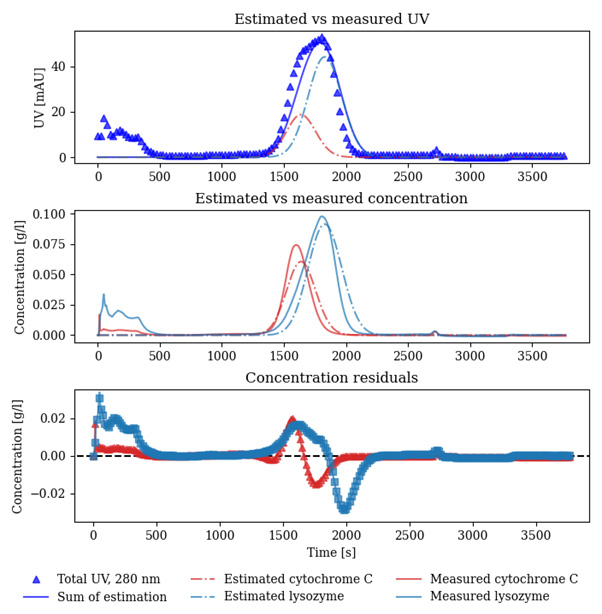
Figure 2: Top: comparison of real-time process analytical technology measurements (triangles) and simulated measurements (solid line). Two components are present in the peak (dash-dotted lines). Middle: measured concentrations of the two components (solid lines) and simulated concentrations (dash-dotted lines). Bottom: model concentration estimation error.
Digital Shadow Methodology: Kalman Filters
Now, imagine that we could combine the real-time measurements from the UV detector to update the prediction of the digital model, such that model errors are corrected in real time as new measurements are obtained. This can be achieved using a technique called Kalman filtering. In Kalman filters, a model forms the basis for predictions of what will occur in a process a small step into the future. This model prediction is then compared to some measurement of the true state of the process at that point in time, and the model prediction is updated to correct for any differences according to some specific rule. The algorithm can be summarized as follows:

- At time
![]() , predict the state of the process at time
, predict the state of the process at time ![]() , where
, where ![]() is a small amount of time.
is a small amount of time. - At time
![]() , obtain a measurement of the true process state.
, obtain a measurement of the true process state. - Update the prediction of the state based on the difference between the prediction and the measurement.
- Set the current time
![]() and return to step 1.
and return to step 1.
By repeating this algorithm throughout the process as it operates, the strengths of both real-time measurements and detailed digital models can be harnessed to obtain the best of both. We implemented the Kalman filter algorithm thanks to the ability of our Orbit software to control the chromatography process, access sensor data in real time, and perform computations simultaneously. The improvement of the digital shadow using Kalman filters over the digital model is shown in Figure 3. In the top graph, we see that the simulated UV signal (solid blue line) overlaps almost perfectly with the real data (triangles) and, looking at the middle graph, a substantial improvement is seen in the fit of the simulated concentrations of the individual components (dash-dotted lines) to the real concentration profiles (solid lines) when compared to the digital model in Figure 2.
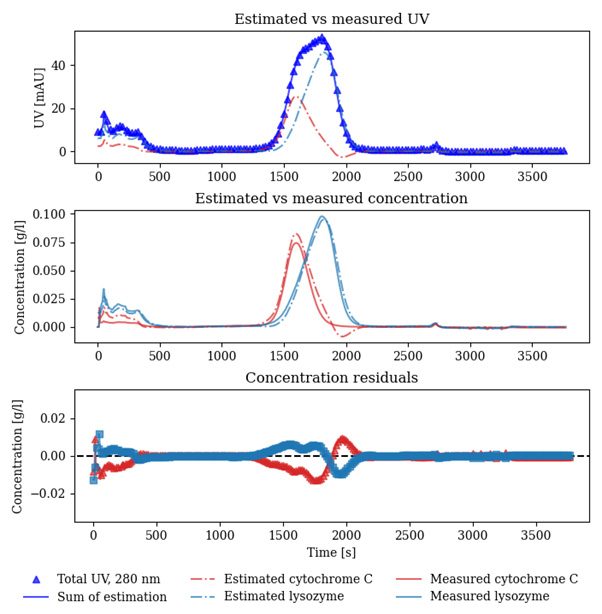
Figure 3: Digital shadow based on Kalman filters compared to real-time data. Top: comparison of real-time process analytical technology measurements (triangles) and simulated measurements (solid line). Two components are present in the peak (dash-dotted lines). Middle: measured concentrations of the two components (solid lines) and simulated concentrations (dash-dotted lines). Bottom: model concentration estimation error.
An interesting phenomenon occurs in the middle graph: the simulated concentration profiles fit very well to the real data, but that of cytochrome C (dash-dotted red line) shows a small dip into negative values right before the 2,000 second mark. This is an effect of the concentration of cytochrome C being over-compensated for as it begins to break through, as seen by the dash-dotted line’s peak being taller than the true concentration profile. When the cytochrome line begins to decrease and that of lysozyme (blue line) begins to rise, the Kalman filter pushes the line further down so as to not overpredict the lysozyme concentration. This has to do with the rule used to update the Kalman filter prediction, and the measurement being a single UV wavelength, which represents the sum of both components passing through the UV detector. An obvious improvement would be to use multiple wavelengths, which is very doable. In fact, we played around with this after the main case study was published and found that it did indeed get rid of the small negative dip, which shows great potential for more robust digital shadow applications in the future. Regardless, the improvement to the model prediction is substantial, as seen in the bottom graph of Figure 3.
Conclusion
Digital shadows, which are a subclass of digital twins, can be implemented in biopharmaceutical downstream processing by applying existing techniques, such as Kalman filters, to combine real-time data obtained from process analytical technology with high-resolution predictions from digital models. This combination of the two can yield improved monitoring of, e.g., chromatography processes in real time by leveraging the strength of the two while compensating for their individual weaknesses. We showcased this in a separation of two components and saw a substantial improvement in the accuracy of the model prediction, allowing us to more precisely differentiate between two overlapping components in chromatography. The digital shadow could be further improved by utilizing multiple UV wavelengths in the measurement.
A natural next step would be to make use of the Kalman filtered predictions to make decisions in the process in real time. In our published paper, we show how the purity of the separation can be monitored in real time and how it is affected by using the Kalman filtered prediction as a basis versus using the bare digital model without real-time data assimilation. Implementing this real-time feedback from the digital object to the physical system would close the data flow loop and result in a fully realized digital twin according to the framework presented by Kritzinger et al. (2018).
 About The Author:
Daniel Espinoza, Ph.D., is a chemical engineer and researcher at Lund University focusing on the automation and digitalization of biopharmaceutical production processes through modeling, simulation, and process control.