
Survey Says: Pharma Perspectives On Implementation & Impact Of Recent Regulatory Guidances
By Peter Calcott, Ph.D., and Peiyi Ko, Ph.D.
 Over the past 10 years, both the U.S. Food and Drug Administration (FDA) and the European Medicines Agency (EMA) have issued new and revised regulations and guidances in an attempt to define, clarify, and modernize their requirements. Ideally, these documents would have aided industry in developing new products that take advantage of new technologies, given budget and personnel limitations in both the regulatory agencies and industry. And in fact, many of these documents have proposed or emphasized radical changes in strategy and operations, but unfortunately such changes are often met with skepticism and concern by industry.
Many of these new guidances — specifically ICH Q8–Q11 — were purposefully designed to aid companies in developing robust quality management systems (QMS), which include components frequently found to be problematic in the industry. Although industry has been clamoring for change, it tends to be reluctant to accept these changes once they are proposed, sometimes for good reason.
 Through our consulting engagements, attendance at technical meetings, and other contact with colleagues, we have observed confusion, reluctance, and difficulty in implementation of these new strategies. Anecdotal observations inspired us quantitatively measure some of these observations in a broad audience across the pharmaceutical and biopharmaceutical industry. We also examined the status of some systems that we have found to be problematic in the industry, even though the new guidance and regulations issued by regulatory authorities were purposefully designed to aid in their implementation and use.
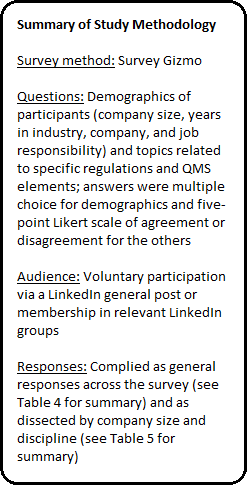
Sidebar 1 describes the methodology used in our survey. (You can also review a more detailed description of the survey methodology and the complete list of survey questions via these links.) This article will share analysis and conclusions derived from the first half of the survey, which covers the implementation of the new regulations. The follow-up article will detail how these regulations have impacted elements of the QMS and its operation.
Job Function (Question 1)
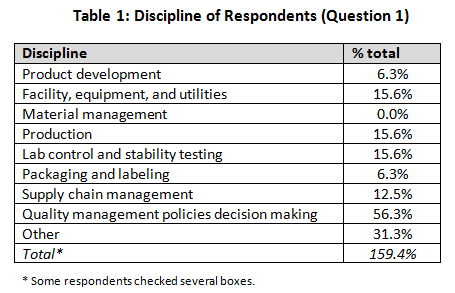
Our demographics for the survey were broad, including primarily quality professionals (56.3%) but with other functions — product development, facility engineering, production, lab operations, packaging and labeling, and supply chain management — each in the 5 to 16 percent range. Several individuals indicated multiple roles, so they were included in each group they checked, for further analysis.
Company Size Based on Revenues (Question 2)
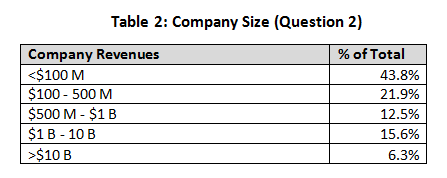
Company size was initially divided into several ranges. Smaller companies (less than $100 million and $100 million to $500 million) comprised 65 percent of the total, and larger companies made up 35 percent. The percentage of responders was split between the various disciplines evenly across all business sizes, so no evidence of skew was noted. We believe that the smaller company category would contain both development-only companies and relatively new start-ups, while the larger revenue groups reflect established companies.
Experience (Question 3)
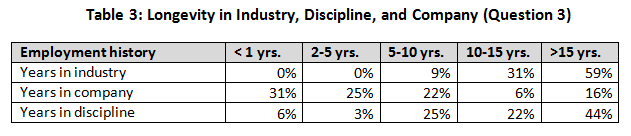
The next three questions were included to define the survey participants with respect to their experience — in the industry, at their company, and in their current discipline. Responses also indicated respondents’’ relative movement in the industry. A vast majority (91 percent) indicated greater than 10 years’ experience in the industry, whereas only about a quarter (22 percent) were with their present company for longer than 10 years.
When company size was evaluated, we noted that the smaller companies had a higher percentage of less-experienced workers (25 percent with less than 10 years versus <5 percent for larger companies). Over half (56%) indicated that they had been in their present company less than 5 years. This confirms that movement from company to company is widespread.
Well over half (66%) indicated that they had been in their discipline for greater than 10 years. This would indicate a lack of movement by people between disciplines (start in one career and migrate to another). These findings support the anecdotal evidence of us in our careers in the industry.
Regulatory Positioning (Questions 4 and 5)
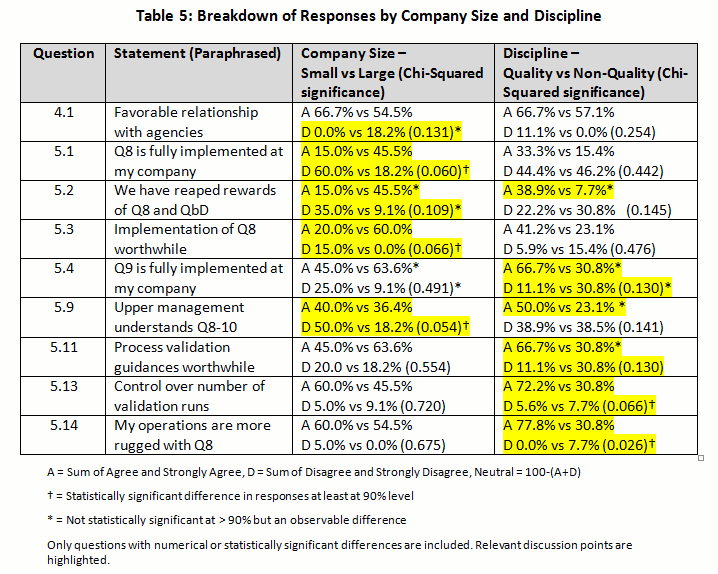
The summary of the percentage for the raw rating responses of each regulatory positioning statement was tabulated in Table 4 (with key points highlighted). The percentage of Strongly Agree and Agree were combined as the “positive” response, while the percentage of Strongly Disagree and Disagree were pooled as the “negative” response. This allowed us to simplify the discussion of the overall directionality of the responses and to perform statistical testing with the Chi-Square analysis comparing the results between (1) small versus large and (2) quality decision-making versus non-quality decision-making groups in Table 5. (For the answers to questions 4 and 5 with a breakdown by company size and discipline, click here.)
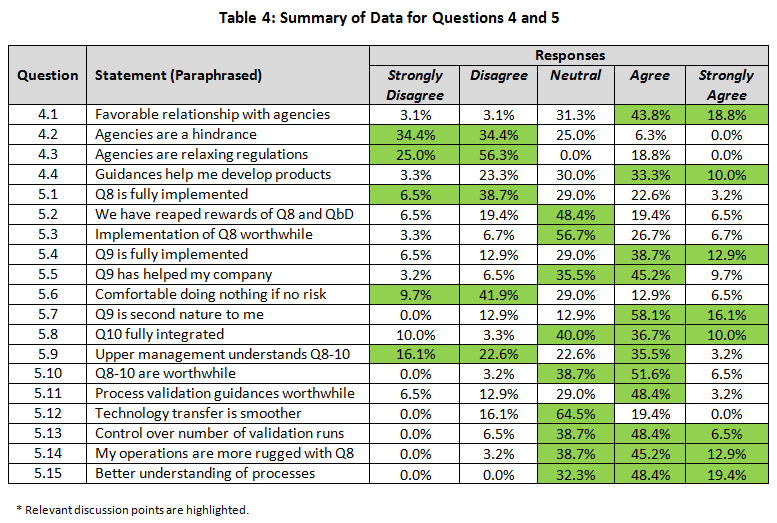
Regulatory Interactions and Regulations (Questions 4.1-4.4)
These questions were designed to measure the perceived dynamics between industry and agency, determining whether it was a collaborative or confrontational relationship.
A minority (6.2 percent) indicated that their company did not have a positive relationship with agencies (FDA and EMA), whereas almost two-thirds (62.6 percent) had positive or very positive relationships (4.1). However, almost a third indicated a neutral relationship. Although not statistically significant, 18.2 percent of responders from larger companies indicated a negative relationship versus zero from small companies — a reflection of decreased contact may be relevant.
Similarly, very few (6.3 percent) felt the agencies were a hindrance to them; a large percentage (68.8 percent) indicated that they were not a hindrance (4.2). In spite of this positive relationship, there was strong belief (81.3 percent) that the agencies were not relaxing their regulatory stances (4.3). However, the opinion of helpfulness of new requirements was mixed, with 43.3 percent believing they helped and 26.6 percent disagreeing (4.4). Only a small percentage had extreme opinions either positive or negative.
We did see a difference between companies of different size with respect to making drug development and commercialization easier. Over half (52.4 percent) of small company respondents believed it helped them (19.0 percent did not), while the exact opposite was true for those from larger companies, (22.2 percent felt it helped and 44.4 percent did not). The difference failed to be statistically significant (p=0.235)
Implementation of ICH Q8 (Questions 5.1-5.3)
Almost half (45.2%) of respondents believed quality by design (QbD) from ICH Q8 (Pharmaceutical Development) had not been implemented in their company, whereas only a quarter (25.8%) confirmed implementation (5.1). Almost 30% were neutral to this statement, indicating that perhaps partial implementation had occurred or they were unaware of implementation activities.
A statistically significant difference based on company size was noted. For small companies, 60.0 percent did not believe it had been fully implemented at their company (while 15.0 percent did), versus 18.2 percent for larger company responses (while 45.5 percent did) (p=0.060).
A similar pattern was seen with respect to reaping the rewards of QbD (5.2). Over 75 percent did not believe that QbD was worth it, as evidenced by 25.9% with moderate to strong negative opinions and almost 50 percent with a neutral response (5.2). Again, the same pattern was seen when the question was asked in a slightly different manner (5.3).
A different response was seen based on company size. For instance, larger companies appeared to have reaped the rewards of ICH Q8 more extensively, with 60 percent agreeing, versus only 20 percent in small companies agreeing (p=0.109). The same trend was witnessed for all other questions related to ICH Q8. In fact, smaller companies felt that Q8 was less worthwhile (20 percent) than practitioners from larger companies (60 percent). This was significant at p=0.066. This indicates that while QbD has not been fully implemented, even when it is, the rewards are still not being seen. However larger companies appear ahead of the game compared with smaller ones for implementation, embedding and reaping rewards.
Implementation of ICH Q9 (Questions 5.4-5.7)
The basic tenet of ICH Q9 (Quality Risk Management) is to prioritize work (and resources) based on its importance and impact on product quality, and as such a direct outcome is that unimportant work can be deprioritized. Further, the principles of Q9 apply to many elements of the QMS and product development.
Implementation of ICH Q9 was viewed much more favorably by respondents than was Q8. Half (51.6 percent) believed it had been implemented fully (5.4), and over half (54.9 percent) indicated that it had aided them in prioritization of their work (5.5). In spite of this, only 19.4 percent felt comfortable deprioritizing areas where the risk to patients was minimal (5.6). However, almost three-quarters (74.2 percent) felt that Q9 was second nature (5.7). These results are positive for the implementation of this guidance but indicated that practitioners are still wary of taking the results and using them to their full advantage.
Implementation of ICH Q10 (Question 5.8)
ICH Q10 (Pharmaceutical Quality Systems) is a new way to approach quality, more along the lines of ISO 9000. Almost half (46.7 percent) of responders confirmed implementation of this guidance, whereas only 13.3 percent could not confirm its implementation (5.8). A sizeable number gave neutral responses (40.0 percent), perhaps indicating partial implementation or uncertainty as to the status. No differences were seen between companies of different sizes or between disciplines.
Integration of ICH Q8-10 (Question 5.9-5.10)
Equal numbers believe that management understands (38.7 percent) or does not understand (38.7 percent) what is going on with respect to implementation of these guidances (5.9). This is not a very favorable endorsement of management, given that almost half of the negative responders held strong negative opinions. Almost a quarter (22.6 percent) was not convinced either way. There was no difference between responses from smaller versus larger companies expressing confidence, yet larger company responders were less likely to disagree with the statement compared to those from smaller companies (18 percent versus 50 percent respectively). That would indicate almost 50 percent were unsure in larger companies.
In spite of negative opinions of management, implementation of all the guidances (5.10) appeared worthwhile (58.1 percent). Less than 5 percent expressed negative opinions, but almost 40 percent were not prepared to commit either way.
Process Validation and Technology Transfer (Questions 5.11-5.15)
New process validation guidances appear to have been implemented well and were viewed as worthwhile (51.6 percent) in companies, with only 19.4 percent believing they had not implemented them at this point in time (5.11).
A majority (54.9 percent) believe they have more control over the number of batches required for validation (5.13). Interestingly, quality professional were more sure than non-quality responders (72 percent versus 31 percent). This was statistically significant at p=0.066.
One goal of all these guidances has been to improve process technology transfers. With almost two-thirds of respondents responding neutrally (64.5 percent), it appears that they have not seen vast improvements, with only 19.4 percent confirming improvements (5.12). The response was similar for both sizes of companies.
Over half (58.1 percent) believe that operations are more robust with these new guidances, whereas a small minority (3.2 percent) disagree (5.14). Quality staff were more confident statistically than non-quality (77.8 percent versus 30.8 percent) that it was better (p=0.026). A similarly high percentage (67.8 percent) believes they have a better understanding of their processes, with a higher percentage agreeing strongly on this question (5.15). No respondents felt understanding had gotten worse. Although not significant, there was a numerical difference between small and large companies, indicating that responders from larger companies were more confident than those from smaller companies (81.8 percent versus 60.0 percent).
It appears progress is being made, but it is not universal. Benefits are emerging from the guideline implementation but we are not yet fully realizing value from the effort.
The survey provided participants with the opportunity to add statements and opinions. In this first part of the survey, four comments were made that were pertinent to the topic. One responder indicated that 21 CFR Part 11 compliance guidances (not a direct focus of the study) were not helpful in interpreting what needed to be done to qualify or validate the “cloud” for data storage. A second person felt that companies in general were reluctant to take the risk and implement these guidances fully, which is born out by the numbers. Two other also commented that inspectors were inconsistent in interpretation of guidances. These findings are highly compatible with the numerical data included here.
Discussion
Most of the ICH guidelines have been out for over eight years (though they are revised occasionally), so we expected they would have been implemented by now. Although industry clamors for change, when it is presented with guidance, it is slow on the uptake. In the case of quality risk management (ICH Q9), it has been implemented very well across companies of all sizes. On the other hand, ICH Q10 appears to be less well-implemented. The radical change in development of products espoused in ICH Q8 (and Q11) has been adopted more slowly, even though Q8 was issued before Q9. In this area, it appears that larger companies have implemented it more extensively than smaller companies (which I can corroborate through my industry interactions).
Even with the level of implementation of guidances such as ICH Q9, they have not reaped all the rewards from the strategy. If your analysis indicates that certain elements or parameters are not impacting product quality significantly, you can chose to not consider or monitor them. However, a large contingent of people still feels uncomfortable doing so. The reasons for this are unclear but may involve a reluctance to trust their analysis or a fear of being “caught” by an inspector and not being able to justify. Some of the write-in comments support these opinions.
Although touted as the new and improved approach to product development, QbD (as described in ICH Q8 and 11) is not something that has caught on quickly. Larger pharmaceutical companies have led the charge, but many smaller companies have held back with a wait-and-see strategy. Even with the larger companies pushing this new approach, the benefits have not been fully realized. Although it was not captured in the survey, the responses of pharma drug companies versus biologics may reveal a different perspective. In general, small molecule drug companies appear to have advanced QbD further than biologics companies.
In the next article, we will focus on how these guidances have impacted our QMS, which has been a focus of the implementation of ICH Q10.
About The Authors:
 Peter H. Calcott, Ph.D., is president and CEO of Calcott Consulting LLC, which is focused on delivering solutions to pharmaceutical and biotechnology companies in the areas of corporate strategy, supply chain, quality, clinical development, regulatory affairs, corporate compliance, and enterprise e-solutions. He is also an academic program developer for the University of California, Berkeley in biotechnology and pharmaceutics postgraduate programs. Previously, he was executive VP at PDL BioPharma, where he was responsible for development and implementation of quality and compliance strategy across the corporation. He has held numerous positions in quality and compliance, research and development, regulatory affairs, process development and manufacturing at pharmaceutical companies including Chiron, Immunex, SmithKline Beecham, and Bayer. He has successfully licensed products in the biologics, drugs, and device sectors on all six continents. Dr. Calcott holds a doctorate in microbial physiology and biochemistry from the University of Sussex in England. You can reach him at peterc@calcott-consulting.com.
 Peiyi Ko, Ph.D., founder of KoCreation Design, creates opportunities for positive changes and innovation through human-system interaction research and human-centered design. She has guest lectured at universities and led workshops. She is also a Certified Professional Ergonomist and collaborates with the Interdisciplinary Center for Healthy Workplaces at UC Berkeley as a consulting expert. She has provided human factors/ergonomics consulting as well as software usability analyses and design recommendations for operational improvements at the Lawrence Berkeley National Laboratory and at BSI EHS Services and Solutions. She obtained her Ph.D. from UC Berkeley in 2012 with additional training from two interdisciplinary certificate programs there: Engineering, Business & Sustainability and Management of Technology.