
Quantitating Binding Similarities In IgG Fcγ Receptor Analysis

Assessment and control of Fc functionality during biotherapeutic antibody development and manufacturing is essential as receptor binding is linked to the safety and efficacy of the final drug. Typically, cell-based assays (such as ADCC, ADCP, and CDC) and/or surrogate binding assays are used for routine monitoring or characterization of the Fc functionality. The use of Biacore ligand-binding assays for studies of Fc receptor–Fc binding is well-established in the area; there is, however, a lack of consensus regarding assay setup. Further, evaluation of the heterogeneous binding kinetics seen with some of the receptors is challenging and can prevent determination of reliable rate and affinity constants. In this application note, our experience with different assay formats is described as well as the use of Sensorgram Comparison, a statistical tool incorporated in Biacore T200 Software v3.0. This software functionality enables quantitative assessment of comparability of complex kinetic data directly from curve shapes without kinetic modeling.
Introduction
Therapeutic antibodies (Abs) are approved for a number of different indications in particular in the fields of rheumatology and oncology. In addition to antigen binding, many therapeutic antibodies also assert their function by means of Fc–Fc receptor (FcR) interactions. As the interest for biologics with immune-mediated effector functions is increasing, engineering of Fc-fusion proteins is growing and biopharmaceuticals like etanercept, alefacept, and abatacept have received considerable interest.
Many different assay formats have been used to study Fc‑FcR interactions, partly in attempts to cope with the well-known complexity in binding kinetics. Examples of published results where the FcR is immobilized and the antibody (Ab or IgG) injected in solution include amine coupling of FcR (1, 2), antiGST capture of GST-tagged FcR (3), and antihistidine capture of histidine-tagged FcR (4–7, 14). Examples of the opposite setup, having the Ab immobilized and the FcR injected, include amine coupling of Ab (8), protein A capture of Ab (9, 10), antikappa F(ab´)2 capture of Ab (11), and antiFab capture of Ab (12). A general consensus regarding assay setup and sharing of best practices would aid when comparing and interpreting results from different studies.
Reported results often consist of affinity data using a traditional kinetic/affinity assay setup with one concentration per analysis cycle. Kinetic data with rate constants are presented by fewer authors (7, 9) as the binding mechanism is unknown and resulting kinetics are complex. FcγRIIIa serves as a good example as the glycosylation state of both Ab and FcR directly impacts binding kinetics. As a consequence, the kinetic models become very complex and this prevents determination of reliable rate and affinity constants. A sensorgram as provided by Biacore T200 system contains fingerprint-like information about the binding event. Here we present a methodology that uses the full binding profile for objective comparison of samples against that of a reference standard. The comparability software tool, Sensorgram Comparison, with its Similarity Score provides a means to quantitate differences/similarities in binding, applied here for IgG FcγR analysis. Further, the software tool has potential for the analysis of other complex structure function relations, selection of candidates and reagents, understanding the effect on binding activity during process optimization and formulations, and batch-to-batch comparisons.
Materials and methods
Recombinant extracellular domains of FcγRs expressed with C-terminal histidine tags in human HEK293 cells were from Sino Biological, Inc. FcγRs were aliquoted, stored at -70°C, and thawed once. Rituximab (RituxanTM: Genentech Inc.), infliximab (RemicadeTM: Centocor Ortho Biotech Inc.), omalizumab (XolairTM: Genentech Inc), and trastuzumab (HerceptinTM: Genentech Inc.) were obtained from pharmacies and stored according to the manufacturer’s instructions. Series S Sensor Chip CM5, Series S Sensor Chip NTA, Series S Sensor Chip Protein A, PBS-P+ buffer (20 mM phosphate, 2.7 mM KCl, 137 mM NaCl, 0.05% (v/v) Surfactant P20, pH 7.35, used for all analyses), Amine Coupling Kit, His Capture Kit, Human Fab Capture Kit, NTA Reagent Kit, and protein L were all from Cytiva. All IgG−FcγR interaction experiments were performed using Biacore T200 system (Cytiva, Uppsala, Sweden) with analysis temperature set to 25°C and sample compartment temperature set to 15°C.
Assay
Six different assay approaches were investigated (see Results) but only the selected assay format is described here in detail. Antihistidine Ab from His Capture Kit was amine coupled in the active and reference flow cell of a Sensor Chip CM5, according to the manufacturer’s instructions. Immobilization levels in the range 6000 to 8000 RU were used, with similar levels in active and reference flow cell. Histidine-tagged FcγRs at a concentration of 0.5 to 1 μg/ml were injected for 60 s using a flow rate of 5 μl/min in the active flow cell only. Capture levels in the range of 60 to 180 RU for kinetic data and approximately 300 RU for affinity data were obtained. A capture stabilization time of 1 to 3 min was applied for some FcγRs. For affinity and kinetic studies, Ab was then injected over reference and active flow cell using five 60-s injections at 30 μl/min, applying a single-cycle kinetics procedure (13). Using this procedure, all concentrations were injected in sequence, in the same cycle, and in order from low to high concentration. A 300-s dissociation time was added after the last Ab injection. Ab concentrations in the range of 1.2 to 300 nM were used for FcγRI, 24.7 to 2000 nM for FcγRIIIa, and 0.5 to 8 μM for FcγRIIa, IIb, and IIIb.
Following each experiment, both flow cells were regenerated using a 30-s injection of 10 mM glycine, pH 1.5. Blank cycles (FcγR capture + buffer injections + regeneration) were performed first, last, and upon change of FcγR subtype. Data were double referenced by first subtraction of reference flow cell and then subtraction of blank cycles. Statistical comparison of sensorgram data was performed using the Sensorgram Comparison feature in Biacore T200 Software v3.0.
Establishing experimental variation of the standard
Sensorgram Comparison relies on comparison of kinetic data of samples against that of a defined reference standard. Exemplified here is FcR binding data for three therapeutic antibodies compared to that of a defined standard, in this case rituximab. Single-cycle kinetic data (13) were used but also multicycle kinetics or a single concentration may be compared, as long as the same type of format and the same settings (e.g., concentrations, injection times) are used for both standard and samples.
The evaluation tool requires at least two replicates of the standard, although obtaining a representative set of data for the standard is highly recommended. Different labs will have different criteria of what is a representative variation. Here, the experimental variation of rituximab binding to FcγRIIIa was established by varying the following parameters:
- Two different persons, using two different Biacore T200 systems, were running five experiments each over a
- period of one month.
- Capture levels for histidine-tagged FcγRIIIa varied by a factor of 3.
- New dilutions of rituximab from stock solution were performed for each run.
- Each run contained duplicate sensorgrams; the same batches of rituximab and FcR were, however, used.
A total of 20 sensorgrams were thus obtained defining experimental variation of rituximab binding to FcγRIIIa. The resulting files were all opened in Sensorgram Comparison and a standard deviation corridor representing the upper and lower limits of experimental variation was calculated (Fig 1).
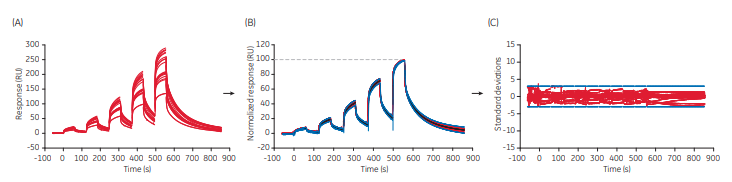
As an alternative, a min./max. corridor using min./max values may be calculated. For quantitation of binding similarities of samples against the defined standard, sample sensorgrams are co-evaluated with the sensorgrams of the standard. The degree of similarity will then be calculated based on how many sample data points falls inside or outside the standard deviation corridor.
For a sample to obtain a Similarity Score of 100%, binding data should be found within the standard deviation (SD) corridor. As such the number of chosen SD for the standard deviation corridor sets the conditions for the similarity calculation.
Experimental factors that influence the SD limits, and hence the Similarity Score, are the number of standard sensorgrams and conditions for running them. Figure 1 exemplifies a case where the experimental variation was thoroughly established. If instead only a few replicates of the standard were run together with the samples, the standard sensorgrams might be very similar and applying 3 SD to the data could result in a very narrow evaluation. The possibility of a sample ending up outside the SD corridor could then be large, leading to lower Similarity Score values. In this case, the number of SD may be increased to widen the corridor. Irrespective of which approach is selected, it is important to be consistent in settings and standard handling to obtain reproducible similarity data.
Calculation of Similarity Score
The Similarity Score is based on the number of data points inside and outside the SD corridor. Data points falling inside the SD corridor are always rated 100%. The sum of squared distances (RU2) to the average curve for outside sample and for SD corridor points are compared for all data points in the sensorgrams. The final score is based on a combined rating of inside vs outside data points.
It is possible to compare either whole sensorgrams or just association or dissociation phases.
The calculated Similarity Score for a sample where 80% of the sample data points are inside the SD corridor:
Similarity Score = 80*1 inside + 20*0.16 = 83.2
0.16 being an example of an obtained ratio between sum of squared distances to the average curve, that is SD corridor point distances/sample distances.
Thus the number of data points outside and how far each of them are from the SD corridor both influence the similarity score.
Results and discussion
Selection of assay format for Ab–FcγR analysis
Different assay formats were investigated to obtain an assay that would work for all FcγRs (FcγRI, FcγRIIa, FcγRIIb, FcγRIIIa, and FcγRIIIb). Table 1 summarizes the results.
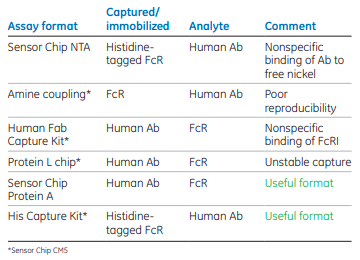
Capture of histidine-tagged receptors to the Sensor Chip NTA resulted in very stable capture. However, rituximab, infliximab, and omalizumab all bound slightly to remaining nickel sites in the active flow cell. This binding was very low but present. Amine coupling of receptor to Sensor Chip CM5 resulted in kinetic data of Ab binding, but reproducibility between different immobilized surfaces was considered not high enough.
The Human Fab Capture Kit and Sensor Chip CM5 resulted in stable capture of Ab and reproducible data for FcγRIIIa binding. However, FcγRI bound nonspecifically to immobilized Ab. Protein L immobilized to Sensor Chip CM5 resulted in unstable capture of Ab. Sensor Chip Protein A resulted in stable capture of Ab and reproducible data for all FcγRs. His Capture Kit and Sensor Chip CM5 also resulted in reproducible data for all receptors.
All assay formats where Ab is captured require large amounts of FcR which could be a limiting factor. Although the format using capture of Ab to Sensor Chip Protein A gave equally reproducible data, the assay format based on capture of histidine-tagged FcRs was selected in this study. The histidine capture format was combined with Ab single-cycle kinetics to save FcR reagents and time. Figure 2 shows an example of the injection sequence using immobilized antihistidine Ab in His Capture Kit assay format.
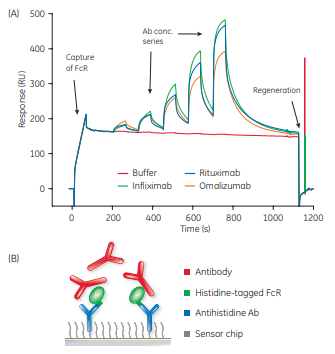
Using the assay format based on capture of histidine-tagged FcRs, the Ab sample is always in solution, retaining full flexibility. The kit ensures low receptor consumption and in combination with the fast single-cycle kinetics, allows the interaction to proceed uninterrupted so that possible conformational changes or, for example, avidity effects are not affected by regeneration.
Comparison of four antibodies binding to FcγRIIIa
The binding kinetics of four therapeutic Abs (15) to two variants of FcγRIIIa was selected as a model system for showing the Sensorgram Comparison functionality.
Visual comparison
The files containing the 20 rituximab sensorgrams showing binding to FcγRIIIa V158 presented in Figure 1 were evaluated together with data of infliximab, omalizumab, and trastuzumab binding. Figure 3 shows how data for each Ab compares with rituximab. Upper panels show the sensorgrams and lower panels the SD corridors.
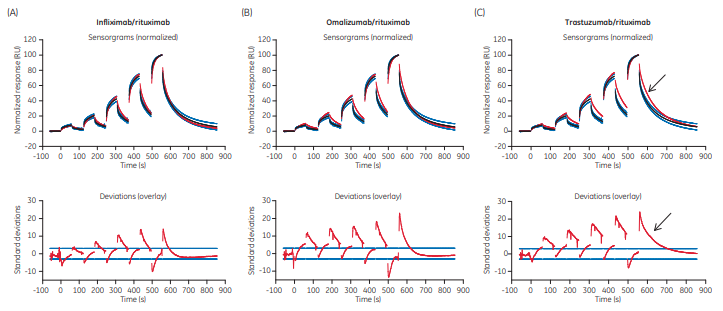
By visual comparison of the sensorgrams it was clear that, for example, the dissociation of trastuzumab differed from rituximab to a higher degree than the other two antibodies (arrows in Fig 3). This is also reflected in the deviation plots where more dissociation data points were outside the limits and farther away from the SD corridor.
Similarity Score
Figure 4 shows final results for the four Ab binding to the two morphologic variants of FcγRIIIa. FcγRIIIa Val158 is known to have higher affinity than FcγRIIIa Phe158, as reflected in the sensorgrams where FcγRIIIa Val158 displays slower dissociation.
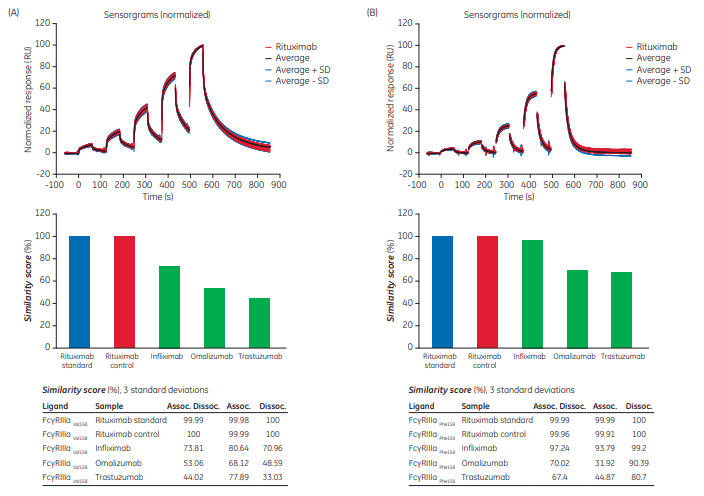
For FcγRIIIa Val158, the bar graph shows that the control obtained a score value similar to the standard. As the standard data was obtained from files collected on other occasions, the standard Ab was also included in the samples run as a control to ensure reproducibility of the binding data.
The three antibodies were ranked obtaining similarity scores of ~ 74%, 53%, and 44%, respectively when comparing the whole sensorgram (Assoc. Dissoc. in the table) for FcγRIIIa Val158. Studying association and dissociation phases separately, differences occurred to a larger extent during the dissociation phase for interactions with FcγRIIIa Val158, as displayed by lower score values, in particular for trastuzumab (33%). Note that for any determination of kinetic data (rate constants as well as Sensorgram Comparison), potential concentration errors would be reflected in the association rate data while the dissociation rate is independent of concentration.
Similarity Score values for FcγRIIIa Phe158 were generally higher than for FcγRIIIa Val158 indicating that binding of Abs to the FcγRIIIa Phe158 receptor variant was more similar. Infliximab interactions were almost identical to rituximab, in particular the dissociation phase. Infliximab and rituximab are both chimeric (murine/human) Ab constructs while omalizumab and trastuzumab are both humanized Abs.
Conclusions
Here, two robust formats for FcγR-Fc binding are described together with a software tool for quantitating similarities/differences in binding, the Sensorgram Comparison.
Of the tested assay formats for IgG Fc function studies, capture of histidine-tagged FcR using the His Capture Kit as well as capture of Ab samples on Sensor Chip Protein A were the two formats found useful for all FcγR.
Sensorgram Comparison enables objective comparison of both complex and simple data, without assumptions of the interaction mechanism. The methodology applies simple statistics to derive at quantifiable output, featuring the Similarity Score. The obtained Similarity Score values may be used as an alternative to regular kinetics and are recommended in cases when the binding mechanism is complex or unknown.
With a robust assay and Sensorgram Comparison, two challenges associated with IgG FcγR analysis and comparability assessment could be resolved.
References
- Bruhns, P. et al. Specificity and affinity of human Fcγ receptors and their polymorphic variants for human IgG subclasses. Blood 113, 3716–3725 (2009).
- Lu, J. et al. Crystal structure of Fcγ receptor I and its implication in high affinity γ–immunoglobulin binding. J. Biol. Chem. 286, 40608–40613 (2011).
- Paul, R. et al. Structure and function of purified monoclonal antibody dimers induced by different stress conditions. Pharm. Res. 29, 2047–2059 (2012).
- Zeck, A. et al. Cell type-specific and site directed N-glycosylation pattern of FcγRIIIa. J. Proteome Res. 10, 3031−3039 (2011).
- Harrison, A. et al. Methods to measure the binding of therapeutic monoclonal antibodies to the human Fc receptor Fc _RIII (CD16) using real time kinetic analysis and flow cytometry. J. Pharm. Biomed. Anal. 63, 23–28 (2012).
- M. Shibata-Koyama, M. et al. The N-linked oligosaccharide at Fc gamma RIIIa Asn-45: an inhibitory element for high Fc gamma RIIIa binding affinity to IgG glycoforms lacking core fucosylation. Glycobiol. 19, 126–134 (2009).
- Luo, Y. et al. Dimers and multimers of monoclonal IgG1 exhibit higher in vitro binding affinities to Fcγ receptors. mAbs 1, 491-504 (2009).
- Hatayama, K. et al. Effective expression of soluble aglycosylated recombinant human Fcγ receptor I by low translational efficiency in Escherichia coli. Appl. Microbiol. Biotechnol. 94, 1051–1059 (2012).
- Heider, K-H et al. A novel Fc-engineered monoclonal antibody to CD37 with enhanced ADCC and high pro-apoptotic activity for treatment of B-cell malignancies. Blood 118, 4159–4168 (2011).
- Zou, G. et al. Chemoenzymatic synthesis and Fcγ receptor binding of homogeneous glycoforms of antibody Fc domain. Presence of a bisecting sugar moiety enhances the affinity of Fc to FcγIIIa receptor. J. Am. Chem. Soc. 133, 18975–18991 (2011).
- Ha, S. et al. Biochemical and biophysical characterization of humanized IgG1 produced in Pichia pastoris. Glycobiol. 21, 1087–1096 (2011).
- Ferrara C. et al. Unique carbohydrate–carbohydrate interactions are required for high affinity binding between FcγRIII and antibodies lacking core fucose. PNAS 108, 12669–12674 (2011).
- Karlsson, R. et al. Analyzing a kinetic titration series using affinity biosensors. Anal. Biochem. 349, 136–147 (2006).
- Hayes, J. et al. Fc gamma receptor glycosylation modulates the binding of IgG glycoforms: a requirement for stable antibody interactions. J. Proteome Res. 13, 5471–5485 (2014).
- Jiang, X. R. et al. Advances in the assessment and control of the effector functions of therapeutic antibodies. Nat. rev./Drug Discov. 10, 101–110 (2011).