
Drug Delivery Systems: Measurement System Analysis Using Continuous Gage R&R Studies, Part 3
By Allan Marinelli and Howard Mann
")
All drug delivery manufacturing systems that undergo quality improvement projects to reduce the defect level while improving the response time of correction(s) involve teams, or an assigned group of stakeholders, to gather as many potential inputs as possible that are intrinsic to the system at question and to subsequently analyze the data to arrive at the most plausible solution(s). These constitute the intent and elements of designing continuous gage repeatability and reproducibility (GR&R) studies.
This is the third article in a series of three articles. In Part 1, we discussed the theoretical/process understanding and potential sources of overall variations from the total measurement system prior to designing a continuous (variable) GR&R study.1 In Part 2, we discussed prerequisites, development and approval of the study protocol phase, the execution sequence, and post-execution.2
In part 3, which is final part of this three-part series, we discuss a generic example of continuous (variable) GR&R using Minitab, including:
- an overview of interpreting the setup and how the data is connected in conducting a generic case study,
- the role of the study director in how the measurement system analysis is set up and configured, including its parameters,
- data entries,
- the analysis phase, and
- two short case studies to illustrate these points.
An Overview Of The Study Setup And Data Entry
Once the relevant stakeholders have a good understanding of what it takes to design a continuous gage R&R as described in the earlier articles of this series, the next step is to enter all input information obtained during the execution of the two trials, derived from the raw data sheets or company generated forms, directly into a suitable statistical software application (in this case, we shall use Minitab software version 17). Alternatively, you can print out the Minitab-generated forms and have the operator (appraiser) manually enter randomized measurements of the parts/devices/items onto the forms and then into the application (see Figures 1 to 17).
Setting up the Study3
The study director will perform the following steps:
- Click on Assistant (Figure 1).
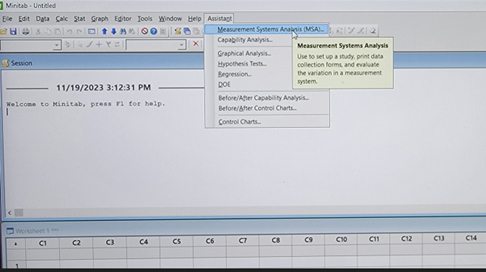
Figure 1
- Choose a measurement systems analysis by clicking on Gage R&R Worksheet.
NOTE: If you want to further understand the intent, click on “more.” (Figures 2, 3)

Figure 2
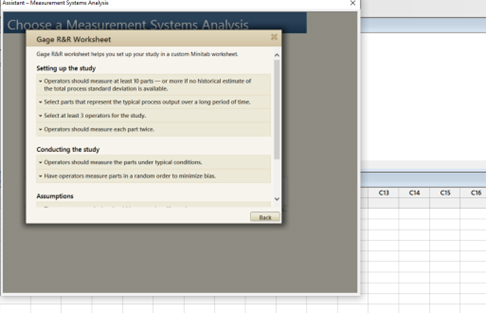
Figure 3
- Select the number of operators (typically, three), number of replicates (at least two), and number of parts (typically, 10).
- It is assumed that the parts selected during the execution phase would represent your known typical operating/manufacturing conditions of manufactured parts falling within the widest (largest) and most diversified acceptable deviation ranges relative to the acceptance criteria, coupled with including their largest acceptable part tolerances. See Figure 4, which illustrates the recommended configurations.
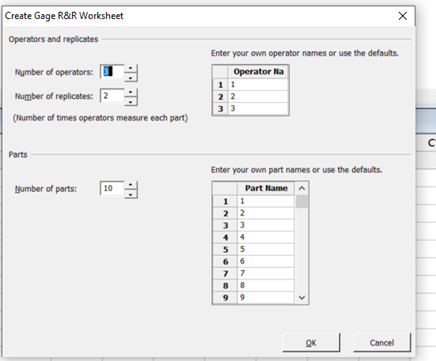
Figure 4
Conducting The Study
- Upon generating the study in Minitab, the form below (a generic example) can be set up by the study director to be printed large enough to allow manual entries to be transcribed by the operators while ensuring that the printout is cut at the end of the entries for Operator A (between columns 9 and 10 per the screenshot) and column C5 since the other columns do not need any entries to be transcribed. Entries are permitted corresponding to the raw data.
- Then, repeat the cutting process on the printout until Operator B (between columns 20 and 21 per screenshot) is completed.
- Repeat the process for Operator C, which now completes the data entries for Trial 1.
- Repeat the process for Trial 2 for Operator A, Operator B, and Operator C.
- Thus, upon the execution phase, each of the operators will acquire their own respective entry forms for them to transcribe their measurements of the randomized 10 parts.
- The parts are randomly assigned by Minitab, and the study director will hand over the parts to the operators in the sequence indicated on the form in Figure 5, as an example:
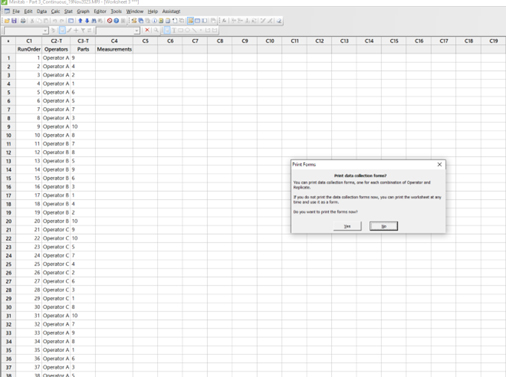
Figure 5
NOTE 2: An optional step for raw data generation and compilation: Another method for allowing manual entries of measurements to be transcribed by the operators (appraisers) is to design a form using Word or Excel for each respective operator by copying/pasting each respective operator entries into three (3) separate forms and then to compile all results into a summary form.
- Data Entry: Once each of the respective operators transcribes their measurements of the parts into the form (raw data), the study director populates all the information for all three operators in Minitab, as shown in Figure 6.
NOTE: The overall data below corresponds to the first trial for illustration purposes only, except for Rows 31 to 40, etc., where entries of the second trial are also displayed for Operator A, coupled with the second trial for Operator B (From Rows 41 to 50), and Operator C (From Rows 51 to 60) respectively.
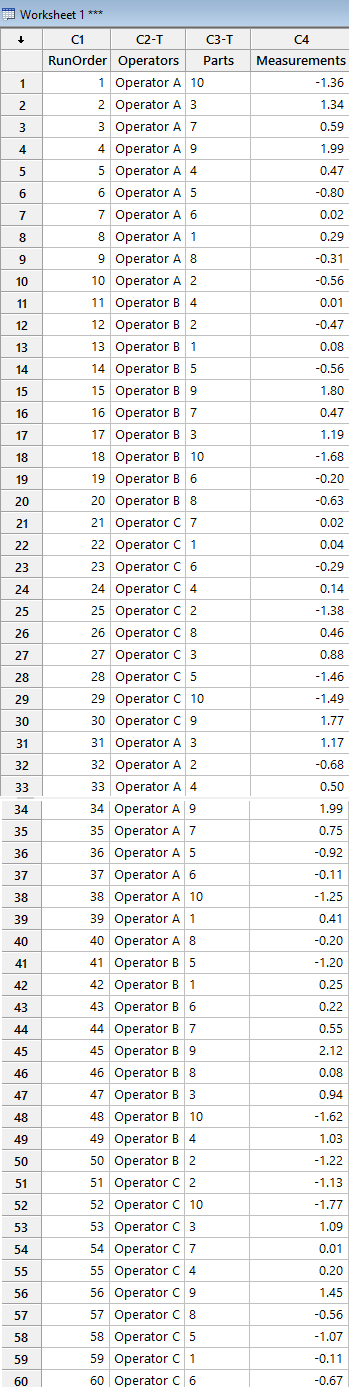
Figure 6
- Analysis Phase: Click on Gage R&R Study (Crossed).
- If you want to further understand the intent, click on “more.” See. Figures 7, 8, and 9.
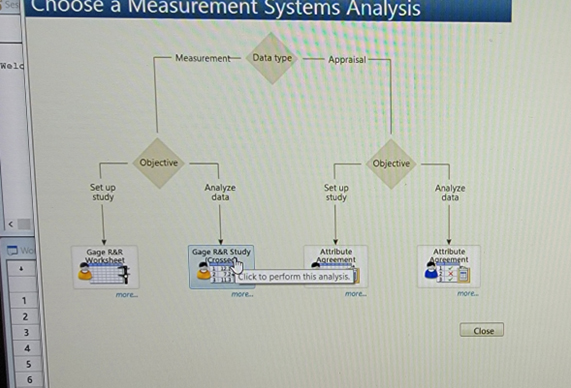
Figure 7
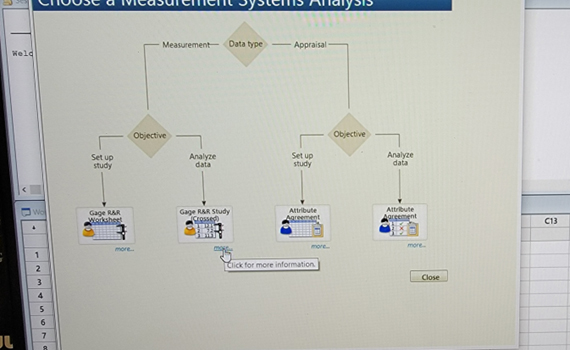
Figure 8
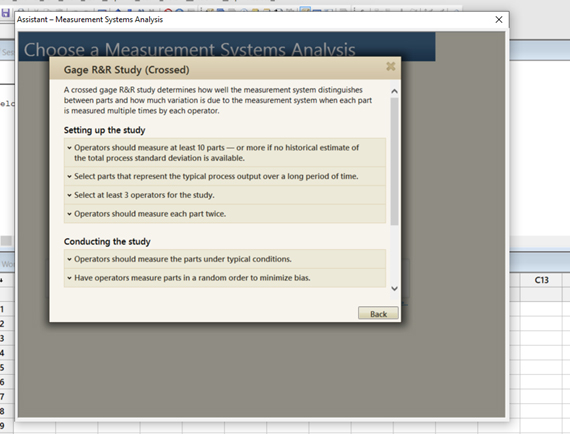
Figure 9
- Select C2 to represent operators, C3 to represent parts, C4 to represent measurements, and upper spec-lower spec of 10 as shown in Figure 10 to represent Case 1:
NOTE: In this case, a historical standard deviation of 5 was configured based on the known trends of fluctuations of previous data generated for this generic case.
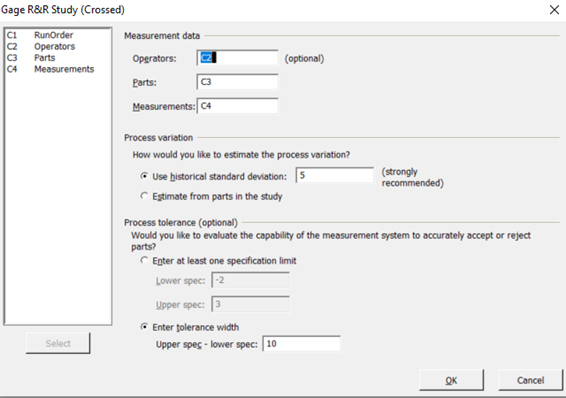
Figure 10
- Click “OK,” and the following graphs (data) will be auto-generated.
Case 1
In this case, by selecting “Use historical standard deviation” as shown in Step 7, the overall process performance, through the use of this current design of continuous gage R&R Study (data), demonstrates a 6.2% process variation (<10% is acceptable) relative to the measurement system variation, while the operators’ measurements represent a P/T ratio (percent tolerance) of 18.6, which determines the capability of the system to be marginal (10% to 30%).
The repeatability (comparing the trials recorded) of the measurements conducted by the same operator demonstrates a larger standard deviation (shown on the Gage R&R Study for Measurement Variation Report Table to be 0.255) compared to the standard deviation among the differences recorded by the other operators (reproducibility) conducting the same measurements of the corresponding parts/devices/items (reproducibility is shown on the Gage R&R Study for Measurement Variation Report Table to be 0.176).
NOTE: From a variation by source perspective, the percent tolerance has a higher impact than the percent s Process variance.
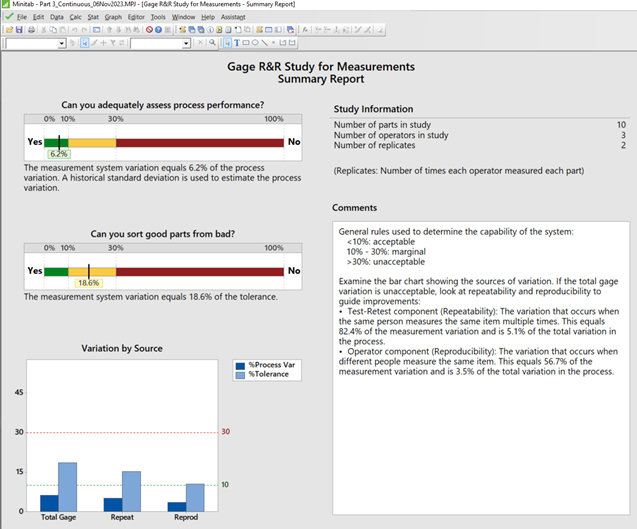
Figure 11
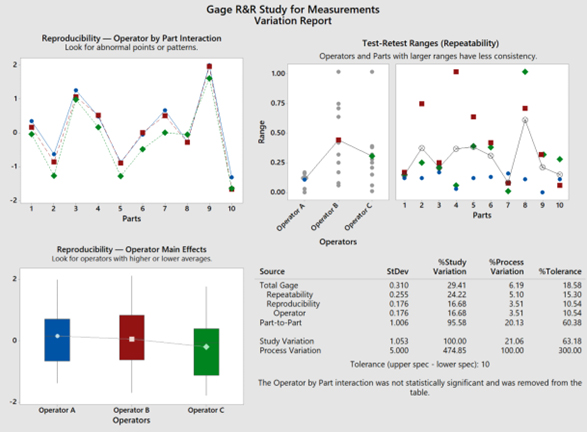
Figure 12
Figure 13
- For Case 2, Select C2 to represent operators, C3 to represent parts, C4 to represent measurements, and “upper spec minus (-) lower spec” of 10, as shown below.
NOTE: In this case “Estimate from parts in the study” is selected in lieu of “Use historical standard deviation”
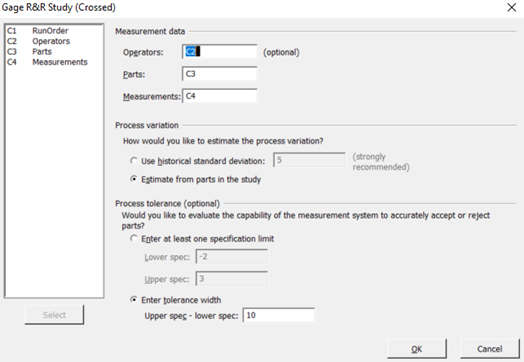
Figure 14
- Click “OK,” and the following graphs (data) will be auto-generated.
Case 2
In this case by selecting “Estimate from parts in the study” as shown in Step 9 instead of “Use historical standard deviation” as shown in Step 7, the overall process performance demonstrates a 29.4% process variation (marginal: 10% to 30%) relative to the measurement system variation, while the operators’ measurements represent a P/T ratio of 18.6, which determines the capability of the system to be marginal (10% to 30%).
The repeatability of the measurements (comparing the trials recorded) conducted within the same operator demonstrates a larger standard deviation (shown on the Gage R&R Study for Measurement Variation Report Table to be 0.255) compared to the standard deviation among the differences of other operators (reproducibility) conducting the same measurements of the corresponding parts/devices/items (reproducibility is shown on the Gage R&R Study for Measurement Variation Report Table to be 0.176).
NOTE: From a variation by source perspective, the Percent Study Variance has a higher impact than the Percent Tolerance, which is dimetric to Case 1 results.
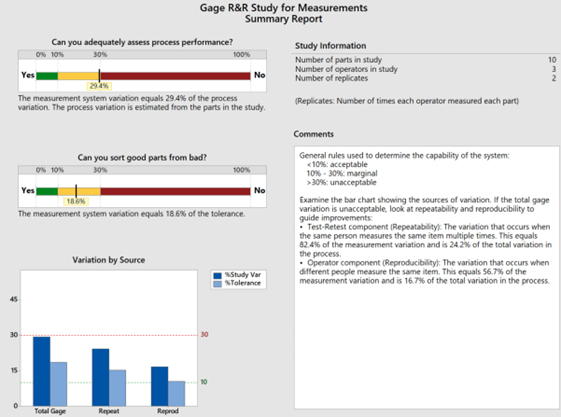
Figure 15
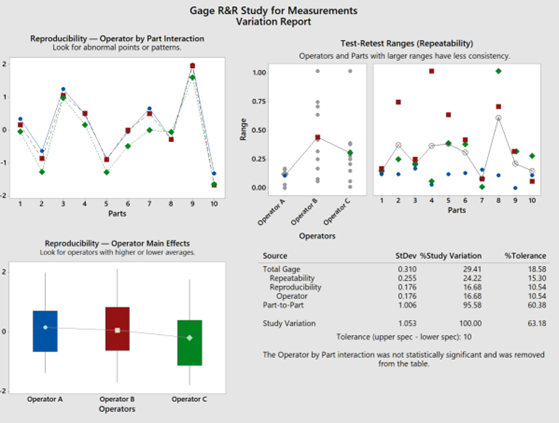
Figure 16
Figure 17
Conclusion
Two cases presented in this article were derived from the same input source data in Minitab, but Case 1 was set up to represent an estimation of the process variation using a historical standard deviation of 5 to generate the output results since it was assumed that historical data was available and factored in.
On the other hand, Case 2 was set up to represent an estimation of the process variation by using estimates from the parts in the study, with the assumption that there are no available historical data (trends, etc.). The exercise demonstrates differences in output results in which, from a “variation by source” perspective, the percent study variance has a higher impact than the percent tolerance, which results in a dimetric scenario compared to Case 1 results.
References
- Drug Delivery Systems: Measurement-System Analysis Using Continuous Gage R&R Studies, Part 1, Allan Marinelli and Howard Mann, Drug Delivery Systems Measurement System Analysis Using Continuous Gage RR Studies Part 1 (meddeviceonline.com)
- Drug Delivery Systems: Measurement-System Analysis Using Continuous Gage R&R Studies, Part 2, Allan Marinelli and Howard Mann, Drug Delivery Systems Measurement System Analysis Using Continuous Gage RR Studies Part 2 (meddeviceonline.com)
- BioProcess International eBooks, 20(9)E1 September 2022, titled “Drug-Delivery Devices: Measurement-System Analysis Using Gauge R&R Studies”, Allan Marinelli and Howard Mann, with Cheryl Scott, Drug-Delivery Systems: GR&R Studies - BioProcess International (bioprocessintl.com)
About The Authors:
 Allan Marinelli is the president of Quality Validation 360 and has more than 25 years of experience within the pharmaceutical, medical device (Class 3), vaccine, and food/beverage industries. His cGMP experience has cultivated expertise in quality assurance, compliance, quality systems, quality engineering, remediation and validation roles controlled under FDA, EMA, and international regulations. His experience includes quality systems, CAPA, change control, QA deviation, equipment, process, cleaning, and computer validation, as well as quality assurance management, project management, and strategies using the ASTM-E2500, GAMP 5, and ICH Q9 approaches. Marinelli has contributed to ISPE baseline GAMP and engineering manuals.
Howard Mann works as an independent consultant and/or contractor in the operational, regulatory, and quality assurance arenas. He has extensive experience in the healthcare industry and provides technical leadership guidance to the business development process, including the product development process in all areas of GxP compliance.