
CDER's FY2017 Enforcement Activity — What Can We Learn?
By Barbara Unger, Unger Consulting Inc.
 The FDA recently published its enforcement statistics for FY2017, a practice it started with the publication of FY2009 data. The metrics provide a high-level overview of enforcement actions including injunctions, seizures, warning letters, and recalls conducted by all FDA centers. This article will look at the data from the enforcement metrics in two ways:
- First, we will address the data presented in the FDA FY2017 slide deck. This data represents all centers of the FDA: Center for Drug Evaluation and Research (CDER), Center for Biologics Evaluation and Research (CBER), Center for Devices and Radiological Health (CDRH), Center for Veterinary Medicine (CVM), Center for Food Safety and Applied Nutrition (CFSAN), and Center for Tobacco Products (CTP).
- Second, we’ve developed additional figures from data in FDA enforcement metrics published between 2008 through 2017 that address only CDER (drugs) enforcement actions. We evaluated trends over the entire interval for a selected set of CDER enforcement actions. The figures in this section of the article are not published in the FDA metrics, although the data comes from those metrics.
Conclusions Based On FDA FY2017 Enforcement Metrics
Each conclusion references the slide number(s) in the FDA deck:
- Three product seizures occurred in FY2017, down from four in FY2016 and a high of 15 in FY2011. The number of seizures decreased consistently since 2011, except for an increase in 2016. This year, CFSAN requested two of the seizures, and CDER requested one seizure. (FDA slides 2 and 3)
- FDA injunctions decreased from a high of 21 in FY2015 to 12 in FY2017. CDER is the most active center this year, with six of the 12 injunctions associated with firms whose products they regulate. CFSAN was associated with five injunctions, and CVM with one. CDRH, CBER, and CTP had none. (FDA slides 4 and 5)
- The total number of warning letters from all centers decreased from 17,232 in FY2015 to 14,590 in FY2016, yet rose in FY2017 to 15,318. The CTP issued 97 percent of the warning letters this year, continuing to be the dominant player. This year warning letters were distributed as follows: CTP (14,875), CFSAN (199), CDER (161), CDRH (42), CVM (35), and CBER (6). Note these include all warning letters, not just those issued for GMP deficiencies. (FDA slides 6 and 7)
- CDRH had the highest number of total recall events in FY2017, as they did last year, with 1,068, followed by CFSAN (794), CBER (669), CDER (348), CVM (65), and CTP (1). These values include all classes of recall events. (FDA slide 8)
- CFSAN had the highest number of recalled products in FY2017 with 3,609. CFSAN is followed by CDRH (3,226), CDER (1,176), CBER (900), CVM (285), and CTP (3). These values include all classes of recalls. (FDA slide 9)
- For all centers and all classes of recalls, the total number of recalled products increased from 8,305 in FY2016 to 9,199 in FY2017. The average number of recalled products over six years beginning in FY2012 is 8,709, with a high of 9,469 in 2012 and a low of 8,044 in 2013. (FDA slide 10)
- CFSAN led FY2017 in the number of Class I recalled products (1,257), followed by CDER (75), CDRH (64), and CVM (51). Neither CBER nor CTP conducted Class I recalls in FY2017. (FDA slide 12)
- CDRH led FY2017 in the number of Class II recalled products (3,078), followed by CFSAN (2,112), CDER (908), CBER (607), and CVM (228). (FDA slide 13)
- CBER led FY2017 in the number of Class III recalled products (293), followed by CFSAN (240), CDER (193), CDRH (84), and CVM (6). (FDA slide 14)
Conclusions Based On FDA Data From FY2008 Through FY2017 For CDER
Data used to construct Figures 1 through 8 below is taken directly from the FDA slide decks of enforcement actions from 2008 through 2017. The figures do not, however, appear in the FDA slide decks. All data is in fiscal years (FY).
- Figure 1 shows the number of product seizures associated with CDER. Seizures gradually decreased between 2008 and 2013, increased in 2014 and 2015, then decreased to one in 2016 and zero in 2017. The number of seizures is low, less than or equal to five, and doesn’t readily allow identification of trends. Figure 1 also shows the number of injunctions associated with CDER increased between 2008 and 2013, decreased in 2014, rose again in 2015, dropped in 2016, and rose to a new high in FY2017. Similar to the number of seizures, these numbers are low and may simply represent normal fluctuation.
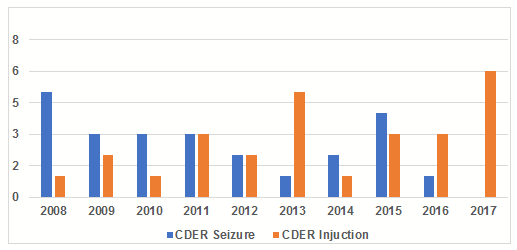
Figure 1: CDER seizures and injunctions
- Figure 2 shows that warning letters issued by CDER increased between 2008 and 2010, then decreased gradually from their peak in 2010 with a marked increase in 2016 and another smaller increase in 2017 that did not quite reach the number issued in 2010. These are not exclusively GMP warning letters but include all warning letters issued by CDER.
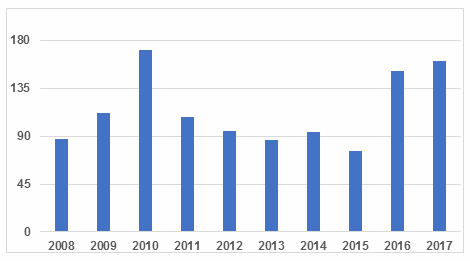
Figure 2: CDER warning letters
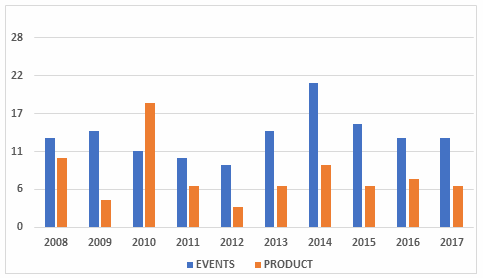
- Figure 3 presents the total CDER recalls events and shows no obvious trend over the period 2008-2017. The number of recall events ranges from 207 to 419, with an average of 297 over the 10 years. The number of recalled products has remained reasonably constant except for 2010 and 2013, where values diminished measurably from the previous year. The value for 2017 continues a decrease starting after 2015. The number of recalled products continues to outnumber the number of recall events.
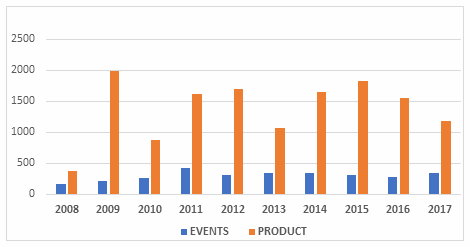
3: CDER recalls total
- Figure 4 shows the number of Class I CDER recall events gradually increased from 2008 through 2011, decreased slightly in 2012, and rose again until 2015, when it fell and continued to decrease again in 2016. The value in 2017 is essentially the same as in 2015. The number of products subject to a Class I recall in each year reached a high point in 2010, decreased in each of the next two years, and then increased, so the number for 2014 was essentially the same as in 2010. In 2015 and 2016, the numbers of recalled products continued to decrease from 2014. The number in 2017 remains above that seen in 2008, 2012, and 2013, but below six of the previous years.
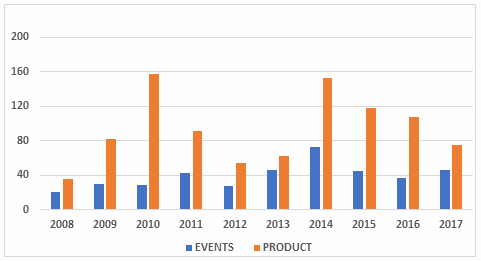
4: CDER Class I recalls
- The question often arises whether Class I recalls as a percentage of total recalls is increasing over time. Figure 5 shows that event values from 2009 through 2013 varied between 9 percent (2012) and 14 percent (2013). In 2014, the value increased to 21 percent, then fell in 2015 to 15 percent, fell again in 2016 to 13 percent, and remained unchanged in 2017. The number of CDER Class I recalled products as a percentage of the total has ranged between 3 percent (2012) and 18 percent (2010) between 2008 and 2017. Overall, except for 2008 and 2010, the value appears to hover around 5 percent.
5: CDER Class I recalls as a percent of total
It’s always interesting to use the past as a road map for the future. The new White House administration stated it intends to diminish regulations; the approach to enforcement actions remains unclear, although FY2017 actions included in this collection do not suggest a dramatic change for CDER. Time will tell. Stay tuned; we will monitor this and let you know if we can identify any clear enforcement trends. So far in 2018, it’s too early to tell.
About The Author:
 Barbara Unger formed Unger Consulting, Inc. in December 2014 to provide GMP auditing and regulatory intelligence services to the pharmaceutical industry, including auditing and remediation in data management and data integrity. Her auditing experience includes leadership of the Amgen corporate GMP audit group for APIs and quality systems. She also developed, implemented, and maintained the GMP regulatory intelligence program for eight years at Amgen. This included surveillance, analysis, and communication of GMP-related legislation, regulations, guidance, and industry compliance enforcement trends. Unger was the first chairperson of the Rx-360 Monitoring and Reporting work group (2009 to 2014) that summarized and published relevant GMP- and supply chain-related laws, regulations, and guidance. She also served as the chairperson of the Midwest Discussion Group GMP-Intelligence sub-group from 2010 to 2014. She is currently the co-lead of the Rx-360 Data Integrity Working Group.
Unger received a bachelor's degree in chemistry from the University of Illinois at Urbana-Champaign. You can contact her at bwunger123@gmail.com.