
An ADE-Derived Scale For Assessing Product Cross-Contamination Risk In Shared Facilities
By Andrew Walsh; Ester Lovsin Barle, Ph.D.; Michel Crevoisier, Ph.D.; David G. Dolan, Ph.D.; Andreas Flueckiger, MD; Mohammad Ovais; Osamu Shirokizawa; and Kelly Waldron
![]() Part of the Cleaning Validation for the 21st Century series
Part of the Cleaning Validation for the 21st Century series

Beginning in 2004, a global team of pharmaceutical toxicologists, industrial hygienists, quality assurance professionals, a cleaning validation professional, and a representative from the US FDA participated in the development of the International Society for Pharmaceutical Engineering's (ISPE) Risk-Based Manufacturing of Pharmaceutical Products (Risk-MaPP) Baseline Guide.1 The purpose of the Risk-MaPP Guide was to provide a "scientific, risk-based approach to manage the risk of cross-contamination."1 The Risk-MaPP Guide was based on the International Conference on Harmonisation's Quality Risk Management Guideline (ICH Q9)2 and encouraged the "selection of the appropriate risk control strategies to be implemented on a case-by-case basis to maintain patient safety and assure product quality."1
Guidance On Managing Risk In Shared Facilities
From a cGMP (quality) perspective, Risk-MaPP provided guidance on how to manage the risk of product cross-contamination in shared facilities, from the four main sources the Risk-MaPP guide identified:
- Mix-up (wrong material being used)
- Retention (residues left in equipment after cleaning)
- Mechanical transfer (transfer of material on contaminated non-product contact surfaces )
- Airborne transfer (material movement through air)
During the planning meetings for the Risk-MaPP Guide, the FDA specifically requested that this guide:1
- provide an approach to quantify the toxicity of drugs
- provide a risk management/assessment model that gives a clear view on how to address the controls to comply with 21 CFR 211.42(c) — for separation/dedication in facilities, etc.
- discuss how the approach fits into cleaning validation.
ADE As A Metric For Assessing Risk
In 2010, the Risk-MaPP Guide was published and introduced the acceptable daily exposure (ADE) as an appropriate metric for assessing pharmaceutical manufacturing risks for worker exposure, and for patient safety (e.g., in cleaning validation), as it is a value based on all the available pre-clinical and clinical data for a compound. In accordance with the principles of ICH Q9, the level of controls required — and the level of effort, formality, and documentation needed (including validation) — are commensurate with the level of risk. Consequently, it is critical to have a means of measuring the level of risk. It should be understood from this article that simply dividing compounds into two classes (highly hazardous and non-hazardous) is fallacious, and that the hazards that drugs present to patients should be viewed on a continuum, as envisioned by Risk-MaPP. This article presents a new hazard rating scale approach derived from the ADE concept that can be used as a visual tool to quickly evaluate and prioritize the relative hazards posed by drugs manufactured in a shared facility or equipment train.
ICH Q9 And Applying Risk In The Manufacturing Environment
The principles behind applying risk in pharmaceutical and biopharmaceutical manufacturing were introduced in ICH Q9, which was formally adopted by US FDA in 2006. ICH Q9 mentioned its applicability to cleaning (including acceptance limits) in Annex II.4 and to validation in Annex II.6. According to ICH Q9, risk is defined as the combination of the probability of occurrence of harm and the severity of that harm. This can be expressed as:
Risk = f (Severity of Harm, Probability of Occurrence of That Harm)
Risk, in terms of a hazard (i.e., the potential source of harm), can also be expressed as:
Risk = f (Severity of a Hazard, Level of Exposure to That Hazard)
If the hazard is intrinsic to an active pharmaceutical ingredient (API), then this general equation can be further refined to:
Risk = f (ToxicityAPI, Level of ExposureAPI)
Calculating Cleaning Risk
Patient risk for adverse effects increases as exposure to a given API or other compound rises above the ADE (which is synonymous with the permissible daily exposure [PDE]; and health-based exposure limits [HBEL], as used in the EU3). This risk is a function of the unique dose-response-duration relationship for each compound and the level of exposure to the compound from, for example, residual API carryover after cleaning. Note that this methodology can be applied to any agent or compound, and is therefore not exclusive to APIs. Consequently, the ADE provides a value that can be used as a surrogate for severity to calculate the potential cleaning risk, as shown in the following equation:
Cleaning Risk = f (ADEAPI, Level of ExposureAPI)
This equation tells us that the risk to a patient from cleaning is a function of the toxicity of the drug and the level of exposure (residues) found after cleaning.
Introducing The Toxicity Scale and Toxicity Scores
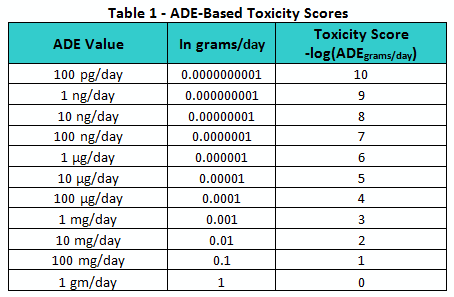
Since ADE values vary over several orders of magnitude, they are hard to compare directly. However, to facilitate such a comparison, the values can be converted into a logarithmic scale in a manner similar to that used to create the pH scale. By converting the ADE values into units of grams per day and taking their negative logarithms, a continuous toxicity scale can be generated, as shown in Table 1. The resulting toxicity scores are shown ranging from 0 to 10. However, it should be understood that toxicity score values above 10 and below 0 can still be legitimately obtained.
Similar to how the pH scale provides a convenient means of quickly assessing and comparing the acidity or alkalinity of solutions, this toxicity scale can be used as a means of comparing the toxicities or hazard levels of pharmaceutical compounds.
Practical Examples And Insights
For example, in Figure 1, the ADE values for four well-known compounds were converted to this toxicity scale. The first compound is dioxin (i.e., 2,3,7,8-Tetrachlorodibenzo-p-dioxin), a well-known and very hazardous compound with an ADE of 35 picograms/day (toxicity score = 10.5). The second compound is arsenic trioxide, a relatively hazardous compound used to treat acute promyelocytic leukemia, with an ADE of 13 µg/day (toxicity score = 4.9). The APIs also include two low-hazard compounds: aspirin, with an ADE of 5 mg/day (toxicity score = 2.3), and sodium chloride, with an ADE of 26 mg/day (toxicity score = 1.6).
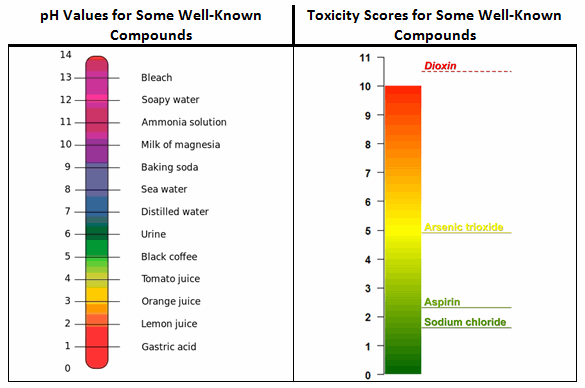
Figure 1: Comparison of pH and toxicity scales
While it is not unexpected to see aspirin and sodium chloride occupying the low end of the toxicity scale and dioxin at the high end, readers may find it surprising to see arsenic trioxide, a compound most people would consider to be quite hazardous, occupying a place at the midpoint of the scale. This illustrates the ADE concept at work: The toxicity of a compound is dose-dependent, so while higher doses of a compound may generate extreme adverse effects, somewhat lower doses may be harmless. The toxicity scale helps to reveal this in relation to other compounds/APIs. It should also be understood that exceeding the ADE by a small amount does not necessarily put patients at risk. For example, a swab result exceeding the ADE-derived limit by a small amount during a cleaning validation study is not an immediate cause for alarm.
A Large-Scale Study Demonstrating The Toxicity Scale Concept
In our previous article3, the ADEs of 304 APIs were compared to their 0.001 dose-based limits as a demonstration of how inaccurate and overly conservative the 0.001 dose-based approach is in estimating safe levels for exposure in patients, which could lead to impractical and unachievable limits. The distribution of these ADE values fits well within the presented scale, with an average toxicity score of 3.7; a median of 3.6; a mode (16 compounds) of 3.3; and a slightly positive skewness of 0.42, indicating a fairly normal distribution for these values (Figure 2). While the analysis did not include all known pharmaceutical compounds, a significant sample of these compounds was represented, with the results indicating that there was not a bias toward highly toxic or relatively nontoxic compounds in the dataset. The analysis also demonstrates that the toxicity scale encompasses the typical range of ADEs quite well.
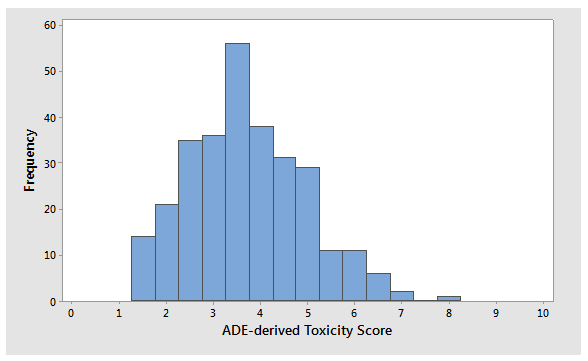
Figure 2: Histogram of ADE-derived toxicity scores for 304 APIs
Practical Uses Of The Toxicity Scale
The toxicity scale can be used to visualize and, quite quickly, understand the relative hazard of different compounds that are manufactured in a common facility. The scale can also satisfy the US FDA's desire for a tool that both identify the hazard of a drug from a maximum safe carryover (MSC) perspective and provides a linkage to cleaning validation. Figure 3 provides examples of how the toxicity scale can be used to visualize the hazards of drug products (as expressed by their toxicity scores and, thus, their ADEAPI values) manufactured in facilities where the hazards are low, moderate, and high; and one where the hazards are mixed.
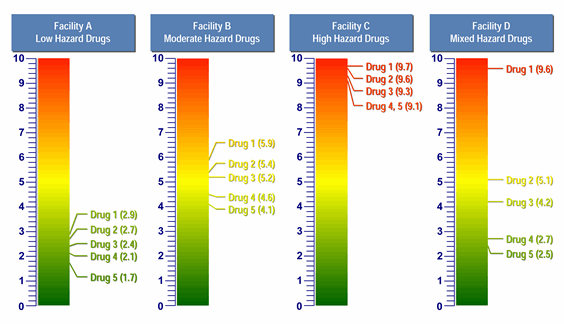
Figure 3: Comparison of four facilities with five products each, using the toxicity scale
In the above examples we can clearly see that, in Facility A, the products are of very low hazard. To manage the risks of operator and patient exposure, this facility would not need to employ the same level of controls as a facility with high-hazard products. Conversely, Facility C handles highly hazardous products and would need to have significant controls in place. It should be understood that, all other factors being relatively equal, lower-hazard products mean lower manufacturing risk and higher-hazard products mean higher manufacturing risk. Using this model, a company can quickly assess whether one facility requires a greater degree of controls than another facility, or, as suggested by the Risk-MaPP Guide, whether a given product is appropriate for introduction and manufacture in an existing facility with its equipment and cleaning practices, or whether adaptation of one or the other is necessary.
Applications To Cleaning Validation
From a cleaning perspective, it should also be clear that Facility A has very low hazards associated with its products, and therefore should not have to put the same cleaning validation program in place that Facility C may require. Facility A may actually be able to use "visually clean" as its sole acceptance criterion for cleaning validation if the maximum safe surface residues (MSSRs) calculated from these ADEs are well above the level that is visible and all surfaces are capable of being inspected. There may also be limited need, or no need, for any continued monitoring based on risk management criteria of an individual facility. On the other hand, the MSSRs for Facility C would most likely be well below the level that is visible for these APIs, so swab/rinse sampling would be required and specific analytical methods may even be needed. Continued monitoring may be necessary. Facility D presents a unique mixture of low, medium, and high hazards. In a case such as this, comprehensive manufacturing controls, swab/rinse, sampling, and continued monitoring may be necessary after Drug 1 (toxicity score = 9.6). Decontamination and other cross-contamination mitigation steps may even be necessary. But Drug 4 (toxicity score = 2.7) and Drug 5 (toxicity score = 2.5) may only require "visually clean" as their sole acceptance criterion for cleaning validation, especially if they are followed by products with low maximum daily doses.
Benefits To Regulators
The toxicity scale can benefit regulators, as well, since an inspector seeing an API toxicity scaling graphic within a facility risk assessment may choose to focus less inspection effort on the cross-contamination controls for Facility A, and move on to Facility C, which presents higher cross-contamination risk. Based on the relatively hazardous products manufactured in Facility C, it would be appropriate for an inspector to spend more energy exploring the cross-contamination controls for such a facility. Facility D has a mix of low-, moderate-, and high-hazard products, and may have different levels of controls in place for handling them. As such, inspectors might elect to investigate how this facility handles these products and may want to focus their inspection on the risk reduction and cross-contamination controls due to Drug 1 and how these products interact with the other products (e.g., mix-up, retention, mechanical transfer, and airborne transfer).
Conclusion
As stated earlier, the US FDA, EU, and other health authorities have, during the development of the Risk-MaPP Guide and through other published guidelines, expressed a strong interest in an "approach for identifying highly hazardous drugs." We believe that dividing pharmaceutical compounds into two classes, highly hazardous and non-hazardous, cannot be scientifically justified, and that the hazards that drugs present to patients should be viewed on a continuum. The new toxicity scale described in this article provides such an approach, and potentially could be used:
- to visually compare the hazard levels or toxicities of pharmaceutical compounds processed within the same or across different facilities
- as a measure of severity in assessing cross-contamination risks in facilities and identifying or determining appropriate control strategies
- to communicate relative severity levels of hazards to internal (e.g., QA, RA) and external (e.g., customers, regulators) stakeholders
- by manufacturers as a tool to quickly assess if a new product can be introduced into an existing facility
- to assist inspectors in identifying facilities and areas with the greatest risk to focus on prior to or during their inspections, potentially accelerating inspections — a benefit to both regulator and industry
- as a health-based severity scale for use in cleaning process FMEAs/FMECAs (failure mode and effects analysis/failure modes, effects, and criticality analysis).
Future Publications
The toxicity scale presented in this article provides a way to measure the relative toxicity of compounds with regard to cross-contamination. A subsequent article will discuss a new scale for probability based on process capability values. Another article will discuss a new scale for detectability based on visual residue limits (VRLs) and maximum safe surface limits. A final article will discuss how these three scales in combination can be used in FMEAs/FMECAs for risk assessment of cleaning or other processes.
Peer Reviewers: Thomas Altmann; James Bergum, Ph.D.; Alfredo Canhoto, Ph.D.; Parth Desai; Mallory DeGennaro; Igor Gorsky; Michael Hyrtzak, Ph.D.; Robert Kowal, Mariann Neverovitch; and Joel Young
References:
- ISPE Baseline Guide: Risk-Based Manufacture of Pharmaceutical Products: A Guide to Managing Risks Associated with Cross-Contamination. (ISPE, Tampa, FL, First Edition, 2010), Vol. 7, p. 186.
- ICH Q9: Quality Risk Management (Step 4) (International Conference on Harmonisation of Technical Requirements for Registration of Pharmaceuticals for Human Use [ICH], London, 2005).
- EMA Guideline on Setting Health Based Exposure Limits for Use in Risk Identification in the Manufacture of Different Medicinal Products in Shared Facilities, www.ec.europa.eu/health/files/gmp/2013_gmp_pc_en.pdf.
About The Authors:
Michel Crevoisier retired from Novartis Pharma in 2015. In his last position, he was a senior QA expert for qualification and validation.
David Dolan, Ph.D., is an occupational, environmental, and quality toxicologist at Amgen Inc.
Andreas Flueckiger has been in charge of occupational health including occupational toxicology in the Roche Group for 30+ years. His department also establishes Roche's health-based limits values used in GMP cleaning.
Ester Lovsin Barle is head of health hazard assessment in Novartis Global HSE & BCM, where she is responsible for development of health-based exposure limits (HBELs), occupational toxicology, and patient safety-related process in support of manufacturing in Novartis globally.
Mohammad Ovais is scientific affairs manager for Xepa-Soul Pattinson (M) Sdn Bhd, Malaysia and a long-time student of cleaning validation.
Osamu Shirokizawa is a director and senior consultant of Life Scientia Limited, a pharmaceutical engineering and consultancy firm.
Kelly Waldron is a senior consultant with Valsource and a regulatory science researcher with the Pharmaceutical Regulatory Science Team at the Dublin Institute Technology.
Andrew Walsh is president of the Center for Pharmaceutical Cleaning Innovation, a non-profit research and educational organization.