
New FDA Quality Report – A World Full Of Inspections

By Louis Garguilo, Chief Editor, Outsourced Pharma

You might expect the FDA still makes most of its biopharmaceutical site inspections at manufacturing facilities located in the U.S. You (okay, me) would be wrong.
But not by a lot.
In FY2018, FDA investigators performed 1,346 Drug Quality Inspections, covering about 29% of what the agency calls it’s “overall site catalog.” Of those inspections, the majority (53%) were performed outside of the U.S. Here’s the country-by-country breakdown:
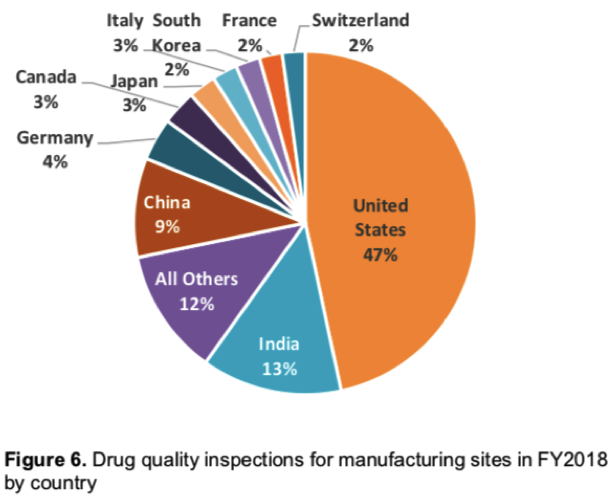
That the FDA now inspects more facilities outside the U.S. – even by this narrow percentage – is significant. For starters, it indicates just how much of our drug supply chain is ex-U.S., and all the ramifications that come with that confirmation.
This year’s results also provide us a benchmark: From now near-equilibrium, we can track future trend trajectory, or who knows, perhaps a reversal some day.
Also of continuing interest will be to watch how individual countries have inspections increased – or decreased (see South Korea below).
Of course much color and analysis will be needed as to why these inspection numbers are what they are.
But immediately they indicate the FDA may be (finally) on a path to catching up with inspection duties worldwide. To many industry observers, that would be belatedly so, and following regrettable biopharma quality disasters (new and old) experienced at China-based (and other international) biopharma manufacturing facilities. (That’s not to say, though, they don’t still occur at home as well.)
The FDA itself claims its “surveillance inspections” are an important leading indicator of the state of global pharmaceutical quality. Inspections are the fundamental method by which the agency monitors conformance to cGMP requirements, identifies quality problems and adverse trends at facilities, and is able to formulate “strategies to mitigate them.”
Which leads to this question: Do FDA inspections correlate directly with improved quality at global manufacturing facilities?
Keeping Inspection Scores
According to the just released “REPORT ON THE STATE OF PHARMACEUTICAL QUALITY,” from the Office of Pharmaceutical Quality (OPQ) at the Center For Drug Evaluation And Research (CDER), there’s a concerted effort to reduce the number of drug manufacturing sites that have never been inspected – and raise site inspection “scores.”
The inspection scores run along a scale of 1 to 10, the higher the score the better. This is a measure of a site’s “compliance to Current Good Manufacturing Practice (CGMP) regulations based on the classification of FDA Drug Quality Inspections conducted over the last 10 years.”
According to the report, inspection scores are “only used for comparison purposes to look for trends and target resources.”
And now they are made public.
The First Time Counts
Getting around to that initial site inspection sets in motion a snowball effect of growing quality compliance. The inspection score of sites receiving an initial inspection (6.0) is “much lower than that of sites that have had two or more routine inspections (7.6).”
In other words, manufacturers get better as they get inspected.
This, opines the report, may be partly due to the fact many of the sites recently receiving initial inspections are smaller, and producing non-application products, and may be less familiar with cGMPs and U.S. regulatory requirements.
“These site-compliance trends highlight the importance of engaging firms that are new in manufacturing for the U.S. market to make sure they understand the requirements,” could be the understatement of the report.
And while above I mentioned this report might serve as a global benchmark for our industry, for now, says the report, “No trends can yet be seen for the inspection score of the overall industry.” That’s because scores did not significantly change from FY2017 (7.7) to FY2018 (7.5).
Statistical Differences
However, “statistical differences between geographic regions, application types, and manufacturing sectors” are discernable.
For example, the score for sites in the EU (7.9) and U.S. (7.7) are higher than average, while sites in China (7.0), India (7.0), and the Rest of the World (7.2) are lower than average (7.5 for 2018).
Some sectors and regions outperform others. For instance, the score for ANDA sites in Europe (8.2) is higher than for ANDA sites in India (7.0).
And while the report cautions that these scores indicate an acceptable level of compliance to CGMPs on average, some of these differences will in fact guide FDA allocation of resources.
Circling back to the idea inspections are effective, when the report ferreted out application types, “the average inspection score for sites that [already manufacture] application products (7.8) is statistically higher than for “No Application” sites (6.6).”
Moreover, these “No Application” sites “consistently and significantly underperform regardless of geographic region. This again highlights the importance of post-market surveillance of these sites,” iterates the report.
Adding And Subtracting
The report notes a level of volatility from year to year in its “site catalog” for inspections. The removing or adding of a large portion of a particular country’s site inventory can indicate such things as “a lack of understanding of the FDA’s registration and listing requirements.”
The FDA “purged a large number of sites from the catalog located in India, China, and especially South Korea in FY2018 because they did not have product in the U.S. market and did not need to be FDA registered.”
“For example, 110 sites in South Korea (~50% of that country’s total number of sites) were removed from the FDA inventory during FY2018 indicating a lack of understanding of the registration and listing requirements.”
This is not a knock on South Korea manufacturing. It’s a matter of understanding which sites in fact need to be FDA-inspected. The FDA says more outreach is needed so countries and individual facilities can better understand FDA requirements.
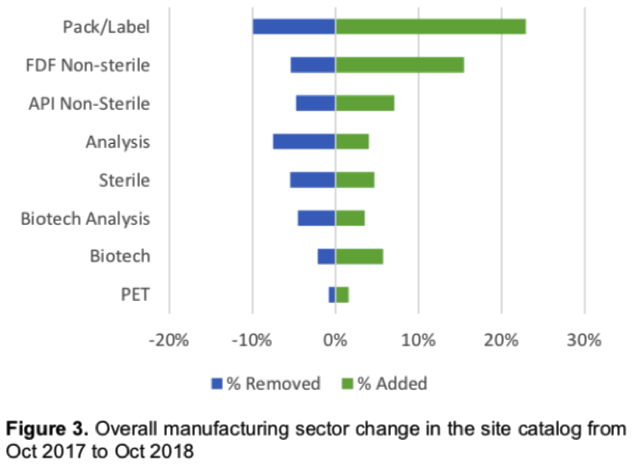
There’s also volatility measured by market segment.
There was a 32.8% net increase in registration of Packaging & Labeling sites in FY2018 (Figure 3 below), potentially indicating an increase in outsourcing certain operations, “which can increase the complexity of the supply chain.” Complex supply chains require additional oversight to maintain the same level of control over quality.
Summary
The Office of Pharmaceutical Quality (OPQ) utilizes this report to inform regulatory decision-making and surveillance activities, and provides findings to “internal FDA business partners to inform their operations.”
Additionally, explains the OPQ, it’s being provided publically so “our external stakeholders can better understand the quality of the U.S. drug supply, we can better engage the pharmaceutical manufacturing industry in a commitment to quality, and we can better inform patients and consumers.”
Now it’s up to us in the industry to figure out how to put this new reporting to work in the pursuit of improving worldwide drug quality and safety.