
Expanding A Bow Tie Risk Analysis Model Using Relational Risk Analysis
By Mark F. Witcher, Ph.D., biopharma operations subject matter expert

A bow tie risk analysis (BT) is an intuitively appealing approach used in many fields, including the pharmaceutical and medical device industries, for identifying, understanding, and modelling risks.1 This article describes how relational risk analysis (ReRA) can be used to enhance and expand a BT to more effectively analyze risks as relationships between mechanisms and events.
BTs use several very important concepts that help build an intuitive understanding of how risks work because they:
- Start with and emphasize a primary concerning risk event, called a “top event.” Most risks are initially identified as a single risk event that causes concern and may be perceived to have an unacceptable likelihood of occurring given its impact.
- Describe risks as relationships between events where cause events and failure modes lead to a top event that then results in harm.
- Show the flow of threat events through preventive barriers and control “systems” to the top event followed by mitigation barriers to prevent harm to subjects.
A representative BT risk model is shown in Figure 1.
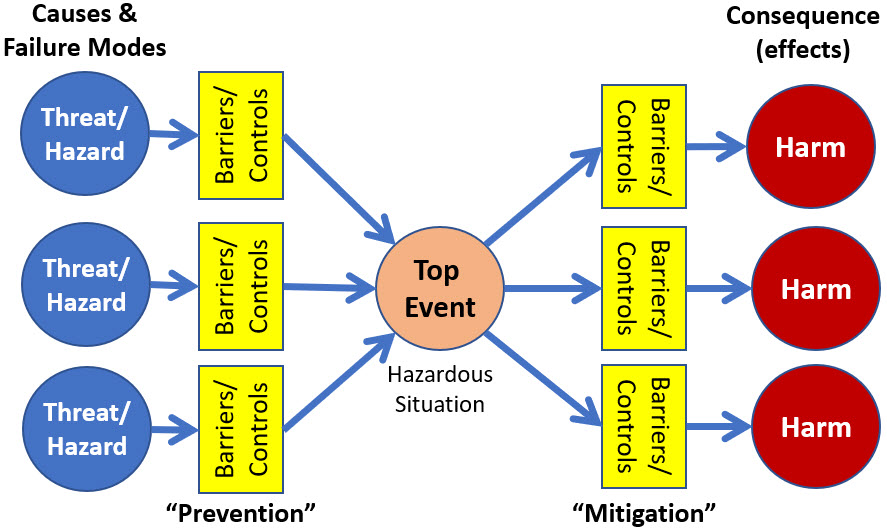
Figure 1: This is a typical bow tie model that focuses on and defines a risk primarily in terms of a top event. Literature searches will find a wide variety of BT models. Some do not include the barrier/control elements while others might show a sequence of significant barriers. The threats may come from diverse sources and the harm events may harm different subjects.
However, the BT model does not include some very important features required for effectively analyzing and managing risks:
- The model comingles many cause events that might produce the top event, and it shows many harm events that could result from the top event occurring. Sorting out which threat events result in which harm events can be difficult.
- As is the case with virtually all of the contemporary risk analysis methods, BT is based on viewing risks primarily as events. While some BT models identify the existence of “barriers and controls,” their contribution to describing and managing risk events is frequently very minimal.
- Both causes and failure modes are combined into a single event. Separating them into cause events and failure modes provides a more robust risk analysis model.
- While likelihood or probability of occurrence is mentioned in some of the BT references and literature, the model does not explicitly provide a method for including the probabilities as a quantitative measure of any of the cause, top, or harm event’s likelihood of occurrence.
- BTs do not address how opportunities can be analyzed to maximize the likelihood of achieving a desired benefit objective.
The first step is to simplify Figure 1 to describe the risk landscape as a set of single analyzable risk sequence as shown in Figure 2. Although risk events do interact, building useful models requires separating them, at least initially, for an effective analysis.
If Figure 1 represents the entire risk landscape, then it can be divided into a set of nine different risk relationships with three threats producing three harms. An alternative view is to show three threats producing the top event and three ways of a top event producing three harm events.
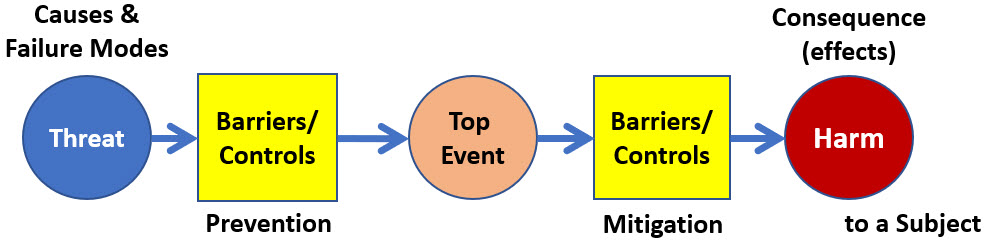
Figure 2: Comingling risks can be addressed by simplifying the BT analysis into a set of single threat-harm risk event sequences. The risk shown is a single threat that ultimately harms a single subject. The model shown does not differentiate cause events from failure modes.
The risk shown in Figure 2 is actually two different risk relationships of the threat causing the top event and the top event causing the harm. Many very important risks have a significant intermediate event that connects the initial threat to harming a subject.
For example, a medical device failure can be modeled as the top event that might result in harm to a patient.2 The initial cause of the overall risk of patient harm is using the device on the patient. The risk of medical device failures, the top event, can be impacted by a wide variety of failure modes associated with using the device. The mitigation of the device’s failure is a secondary set of barriers and controls associated with managing and treating the patient after the device’s failure to prevent or mitigate the harm.2
For risk landscapes where there are parallel risks, e.g., multiple threats can cause the top event or the top event can cause multiple harms, then the individual risks should be separated and analyzed individually so the relationships can be clearly defined for evaluation. From an analysis approach, each risk relationship should be defined by a system risk structure (SRS) that describes the relationship between the risk mechanisms and the risk events.
Taking the simplified BT model in Figure 2 and expanding it using the ReRA approach to build an SRS of each risk is shown in Figure 3. The SRS separates the initiating cause events for each relationship from the system failure modes.
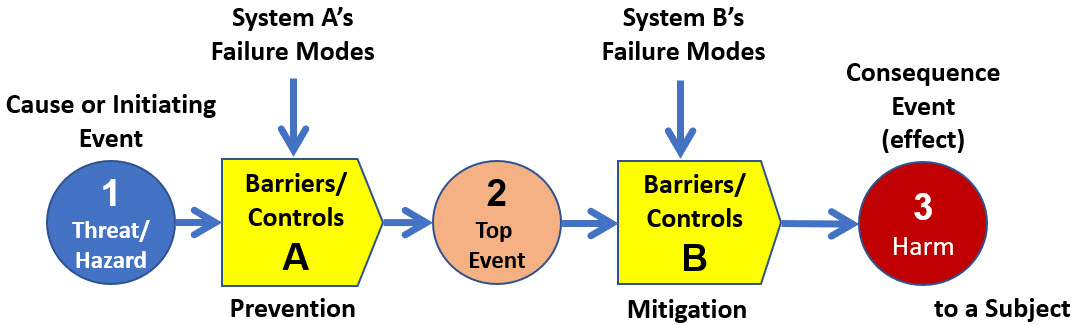
Figure 3: This shows an expanded SRS view of the risk analysis model shown in Figure 2. The threats and failure modes are separated because the ReRA model treats them differently. The threat causes the top event. The failure modes change the way the system produces the top event. Although a failure mode cannot cause an event if the initiating event does not occur, some failure modes can make the effect event almost certain should the cause event occur.
In the case of the medical device example, the threat would be the decision to use the device, and the failure modes would impact the performance of the system in producing the device’s failure (top event). As will be shown, separating threats from failure modes is a critical modeling feature providing a significantly more robust model that greatly improves the understanding of how risks behave.
To further understand the model of the risk relationship shown in Figure 3, the elements are:
- Cause event – This initiates the risk by passing through the system to result in the effect event. The threat (1) is the cause of the top event (2), and the top event is the cause of the harm (3). If the cause does not occur, then the harm cannot occur. Some cause events are deliberately initiated and have a probability of occurrence of one (certain).
- System (barrier/controls) – This is the risk’s mechanism of action by which the cause event produces the effect event. The system can be any combination of people, equipment, methods, actions, procedures, or anything else that takes the cause event and produces the effect event. The system may be subject to one or more failure modes that impacts the system taking the cause and producing the effect.
- Failure mode (FM) – This is a secondary factor event to a system that degrades the performance of a risk mechanism’s likelihood of success. An FM cannot result in a harm if the cause event does not occur. However, an FM can make the harm nearly certain to occur if the cause occurs. The system may also be subjected to a different secondary factor as an improvement opportunity (IO) that can improve the performance of a barrier system.
- Effect event – This is the outcome event of the risk mechanism or system that harms the subject.
If any of the cause event, system (barrier/controls), effect event, or subject changes, a different risk is described.
In a classical BT as shown in Figure 1, if the barriers or controls are included at all, they are very secondary to the events in the analysis. What separates ReRA from most other risk analysis methods is that the barriers or systems as shown in Figure 3 become the primary focus of the risk analysis. The analysis to a large extent emphasizes the performance of the system because the probability of the system producing the effect decides the probability of the effect occurring.
One of the most important results of a risk analysis is to understand which events are causative and which are failure modes. Event-based BTs treat them the same, but an enhanced ReRA system-based BT would provide a mechanism for separating them and analyzing them as two different sources of uncertainty for the system’s output consequence.
However, for any risk analysis method to be effective, it must quantify both the severity and probability of an event’s occurrence. For discussion, severity of impact is assumed to be obvious, with the impact acceptable or unacceptable based solely on its probability of occurrence.
In order for an analysis team to reach a consensus, they must estimate and communicate the probability of occurrence of an event using a common, well-defined measure to reach a common understanding. As a further challenge, the measure used within the team must also communicate the results to decision makers who did not participate in the analysis.
Making A BT Quantitative
Integral to ReRA is a likelihood rating method of estimating and communicating the likelihood of an event’s occurrence base on the risk’s mechanism of producing the consequence event. Expanding Figure 3 into a probabilistic relationship is shown in Figure 4.
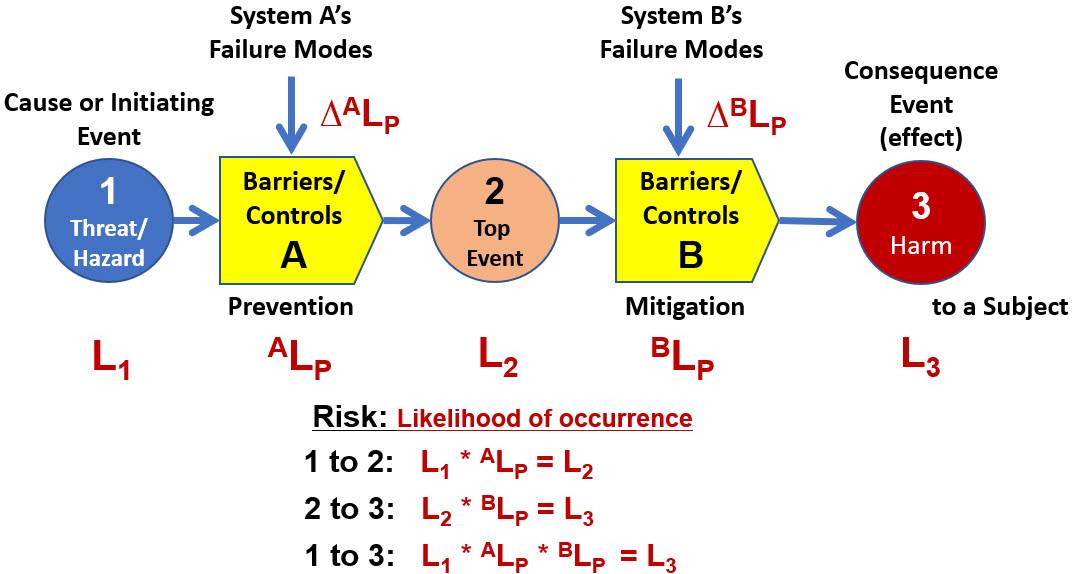
Figure 4: The BT model is expanded with ReRA’s quantitative modeling approach that includes estimating the likelihood of the risk’s events occurring L# and systems propagating events XLP. By convention, ReRA identifies events with numbers (#) while letters (X) designate mechanisms (barriers or controls).
The SRS model in Figure 4 describes three risks. The first is the threat (1) going through system A, producing the top event (2). The second is the top event (2) going through system B, producing the harm (3). The final risk is the threat (1) going through both A and B, producing the final harm (3).
The likelihoods, treated as Bernoulli single trial probabilities, can be quickly and concisely estimated and communicated by an analysis team using ReRA’s order‑of‑magnitude likelihood rating system that ranges between ≤ -7 (≤ 0.00001%), 0 (50%), and ≥ 7 (≥ 99.99999%) as described in the references.2-6 Unless a very large amount of data and information is available about an event’s probability (L#) or mechanism’s performance probability (XLP), an order-of-magnitude estimate is sufficient for making the vast majority of risk acceptance or management decisions.
Discussion
While a BT analysis is most associated with preventing a harm risk, the same event flow model can be used to analyze the events and systems required to turn an opportunity into a benefit. The same risk principles apply, except the systems are not barriers but rather systems that have a high likelihood of producing the beneficial outcome from an opportunity as a benefit risk.
Good examples of benefit risks are procedures and supply chains.5,6 Both require control mechanisms or systems that maximize the probability of successfully taking an initiating event and producing the desired outcome event.
When augmented with basic ReRA principles, BTs provide a very useful model of risk landscapes. The primary purpose of a risk analysis is identifying, analyzing, and managing the risk’s barriers and controls. While the quantitative numbers are useful, the primary purpose of a risk analysis is to understand the performance of the barrier and controls to determine if the risk is acceptable or not. If the risk is unacceptable, the systems must be improved by either reducing failure modes or adding improvement opportunities to make the risk acceptable.
References
- Fiorentini, L., Bow-Tie Industrial Risk Management Across Sectors – A barrier-based approach, Wiley & Sons Ltd, 2022.
- Witcher, M.F., A New Approach To ISO 14971 For Better Medical Device Risk Analysis, Med Device Online, October 23, 2024. https://www.meddeviceonline.com/doc/a-new-approach-to-iso-for-better-medical-device-risk-analysis-0001
- Witcher, M.F., A New Approach for Minimizing Human Errors in Biopharmaceuticals and Medical Devices, Bioprocess Online, February 3, 2025. https://www.bioprocessonline.com/doc/a-new-approach-for-minimizing-human-errors-in-biopharmaceuticals-and-medical-devices-0001
- Witcher, M.F., Managing Contamination Risks in the Pharmaceutical and Medical Device Industries Using Relational Risk Analysis, BioProcess Online, February 2, 2025. https://www.bioprocessonline.com/doc/managing-contamination-risks-in-the-pharmaceutical-and-medical-device-industries-using-relational-risk-analysis-0001
- Witcher, M.F., Using Relational Risk Analysis to Control Procedure Failures, February 15, 2024. https://www.bioprocessonline.com/doc/using-relational-risk-analysis-to-control-procedure-failures-in-the-bio-pharma-medical-device-industry-0001
- Witcher, M.F., Managing Supply Chain Risks Using Relational Risk Analysis, April 5, 2024. https://www.meddeviceonline.com/doc/managing-supply-chain-risks-using-relational-risk-analysis-0001
About The Author:
 Mark F. Witcher, Ph.D., has over 35 years of experience in biopharmaceuticals. He currently consults with a few select companies. Previously, he worked for several engineering companies on feasibility and conceptual design studies for advanced biopharmaceutical manufacturing facilities. Witcher was an independent consultant in the biopharmaceutical industry for 15 years on operational issues related to: product and process development, strategic business development, clinical and commercial manufacturing, tech transfer, and facility design. He also taught courses on process validation for ISPE. He was previously the SVP of manufacturing operations for Covance Biotechnology Services, where he was responsible for the design, construction, start-up, and operation of their $50-million contract manufacturing facility. Prior to joining Covance, Witcher was VP of manufacturing at Amgen. You can reach him at witchermf@aol.com or on LinkedIn (linkedin.com/in/mark-witcher).