
Cleaning Process Capability: Risk-Based Cleaning Process Performance Qualification
By Andrew Walsh; Thomas Altmann; Joshua Anthes; Ralph Basile; Alfredo Canhoto, Ph.D.; Stéphane Cousin; Hyrum Davis; Parth Desai; Boopathy Dhanapal, Ph.D.; Jayen Diyora; Igor Gorsky; Benjamin Grosjean; Richard Hall Hall; Ovais Mohammad; Mariann Neverovitch; Rod Parker; Miquel Romero-Obon; Jeffrey Rufner; Siegfried Schmitt, Ph.D.; Osamu Shirokizawa; Steven Shull; Stephen Spiegelberg, Ph.D.; and John VanBershot

Part of the Cleaning Validation For The 21st Century series
This article, the sixth in a series on process capability, was preceded by an article on selecting sample sizes.1 This article examines the number of cleaning process performance qualification (PPQ) runs necessary based on risk to the patient using the sample size determinations from the previous article.1
After determining the number of samples necessary,1 the cleaning validation subject matter expert (SME) wants to know how many PPQ runs are necessary. The goal should be to demonstrate a cleaning process capability of at least 2.0 as suggested in ASTM E3106.2 The question is how to go about demonstrating this with a high degree of assurance while minimizing the number of qualification runs. We will examine this question using a set of simulated data based on total organic carbon (TOC) swab data from an actual cleaning validation that had a mean of 150 and a standard deviation of 70.3
Simulation 1 considered starting with the minimum sample size of three, with an acceptance limit of 1,000 ppb (1 ppm) of TOC. Random normally distributed data were generated with a target mean of 150 and a standard deviation of 70. The data generated are shown in Table 1.
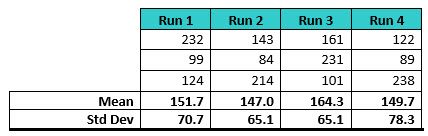
Table 1: Random TOC Swab Data Used for Simulation 1. Three data points were generated four times to represent data from four runs.
For this analysis, these data were analyzed for process performance (Ppu) and the data were combined after each successive run. The results are shown below.
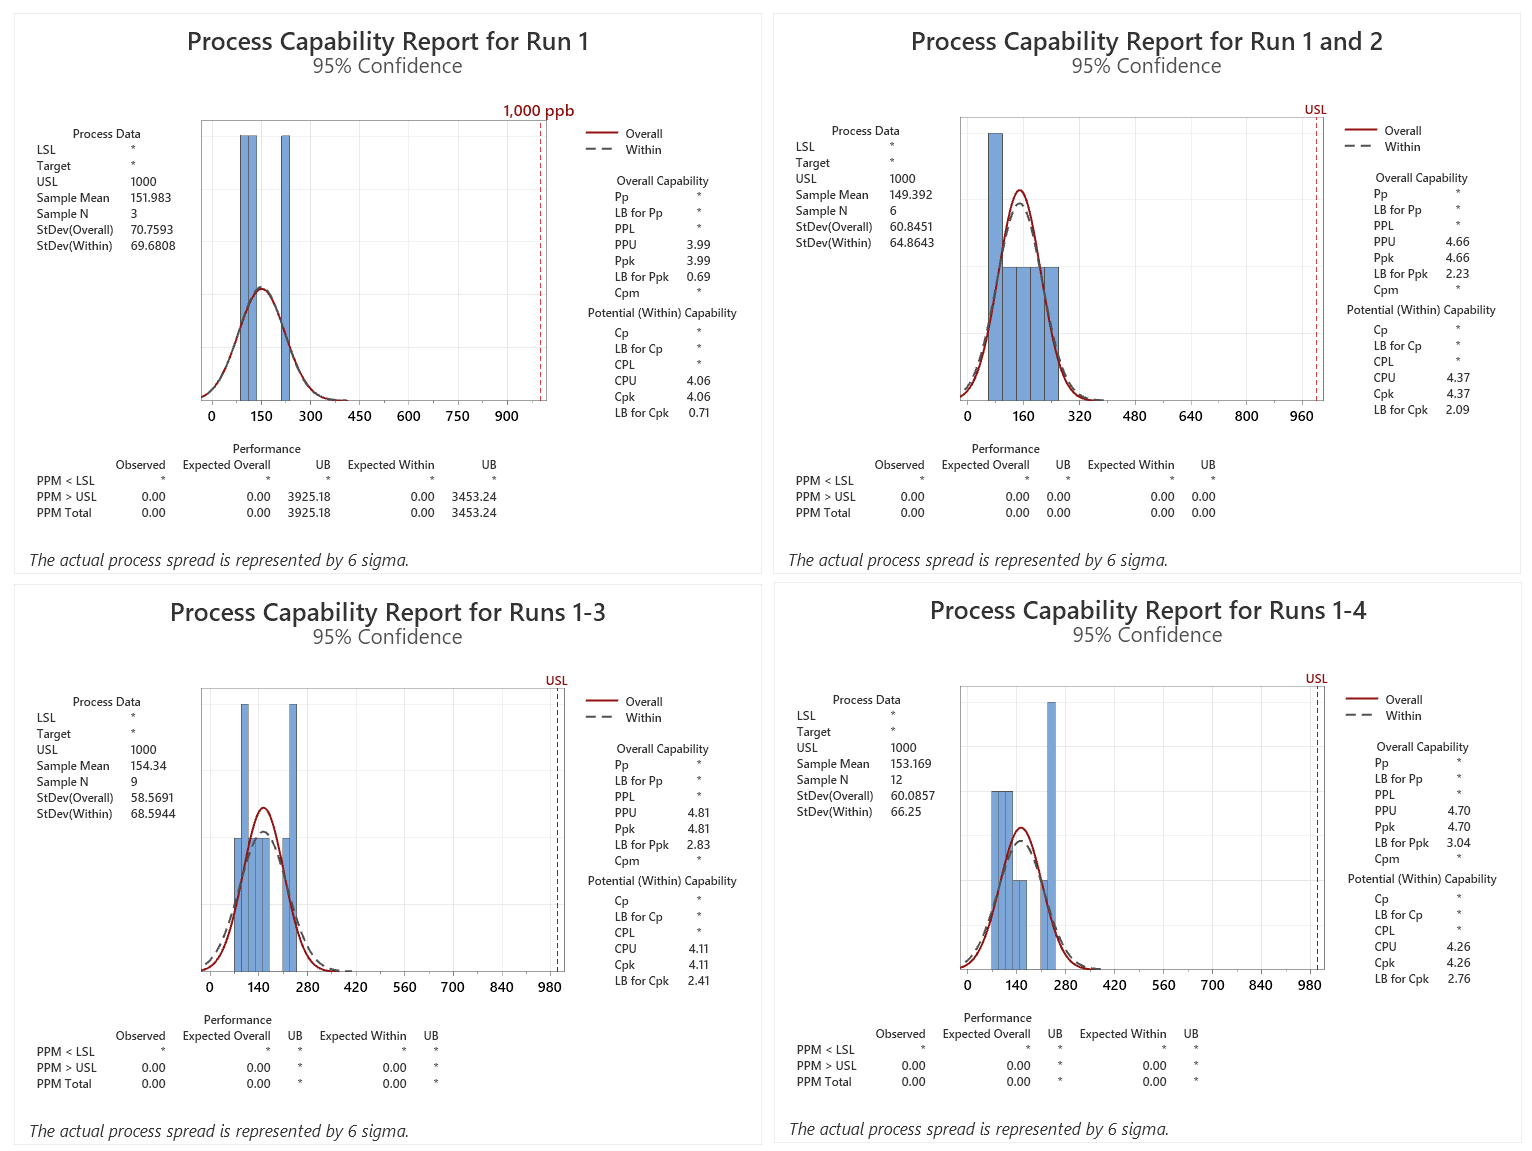
Figure 1: Process Capability Report for Runs 1–4. Note: Results were added to each run from the previous run(s).
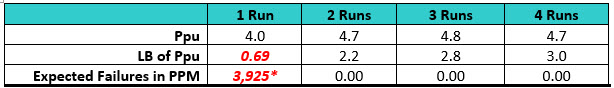
Table 2: Process Capabilities of the Swab Data for Each Run. Note: Results were added to each run from the previous run(s).
*For the first run there were 3,925 expected numbers of failures per million samples (PPM) calculated from the sample data at the upper bound (UB). The software reported the UB for the Ppk but as a “worse case,” the lower bound (LB) should be used.
Here we see that the Ppu is 4.0 for the first qualification run and the minimum criterion of a sigma level of 2.0 has been met, but the lower bound (LB) of the Ppu is only 0.69. As per ASTM E3106, the LB (lower confidence interval) is reported. In addition, the expected number of failures at the UB was 3,925 PPM, which would be significantly higher at the LB.
After a second qualification run was performed, the Six Sigma criterion was met for both the Ppu and LB and the number of expected failures at the LB fell to 0.00 PPM. Third and fourth qualification runs did not significantly improve the Ppu at this LB. In this simulation it appears that a minimum of two runs may be necessary, which could also be a sufficient number of runs with the sample sizes used.
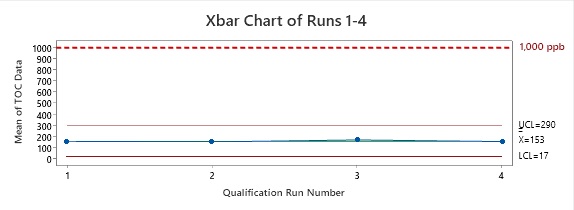
Figure 2: Control Chart of Runs 1 Through 4. The data points plotted are the means of the data collected from each run. As we know from the central limit theorem,1 these means are equal to the means of the total sample population. From this, we know that the TOC values of all samples are below the acceptance limit of 1,000 ppb of TOC.
Simulation 2 – The FDA Guidance for Process Validation4 states that “in most cases, PPQ will have a higher level of sampling, additional testing, and greater scrutiny of process performance than would be typical of routine commercial production.” So, this simulation considered starting with the initial sample size of 12 with the possibility of reducing the sample size to three samples in the subsequent runs. The acceptance limit also was 1,000 ppb of TOC. Random normally distributed data were generated with a target mean of 150 and a standard deviation of 75. The data generated are shown in Table 3.
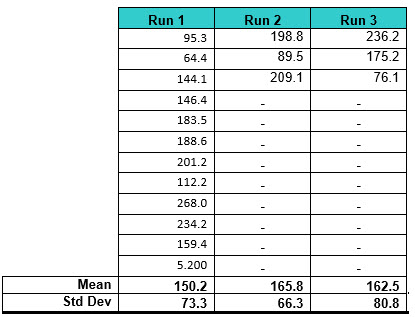
Table 3: Random TOC Swab Data Used for Simulation 2. Twelve data points were generated for the first run and three data points for the second and third runs.
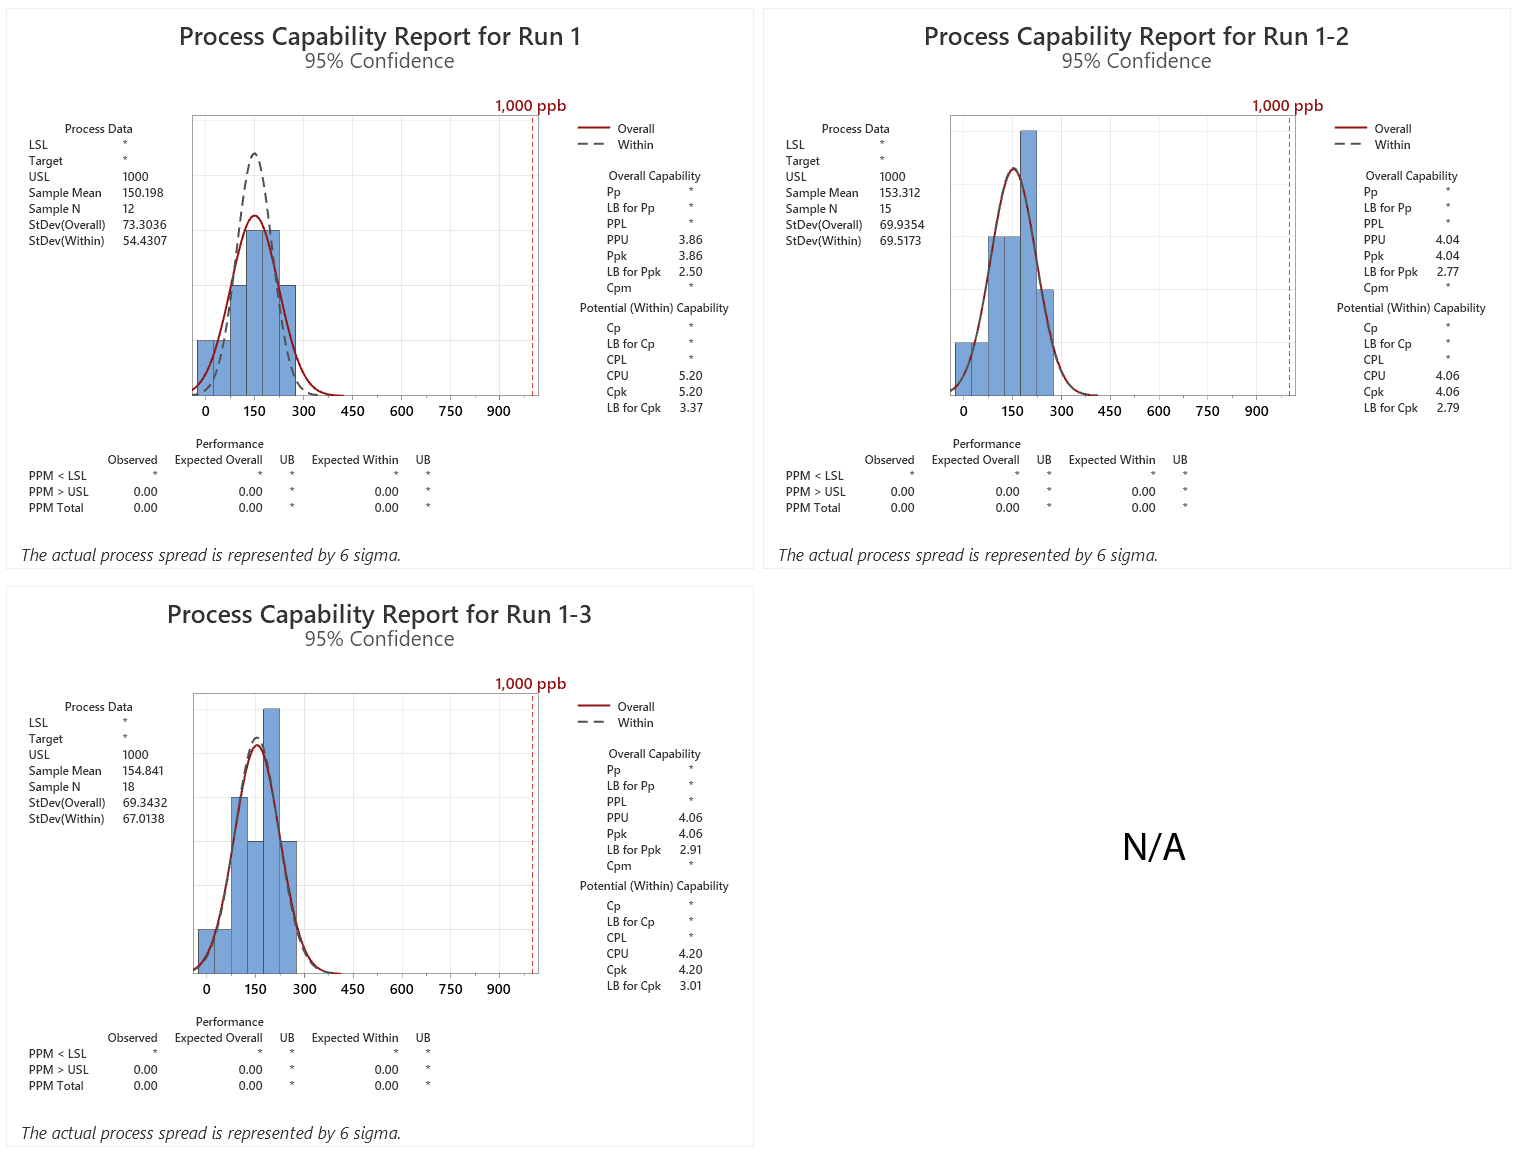
Figure 3: Process Capability Report for Runs 1–3. Note: Results were added to each run from the previous run(s).
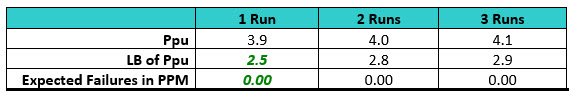
Table 4: Process Capabilities of the Swab Data for Each Run. Note: Results were added to each run from the previous run(s).
In this simulation the LB for the first qualification run is 2.5 and the minimum criterion of a sigma level of 2.0 has been met. In addition, the expected number of failures at the LB was 0.00 ppm.
After a second qualification run was performed the Six Sigma criterion was again met and the number of expected failures at the LB was again 0.00 ppm. A third qualification run did not significantly improve the Ppu or the number of expected failures for this LB. At this point, a fourth qualification run was considered unnecessary.
In this simulation it appears that at least one or two runs may be sufficient with the initial sample size used.
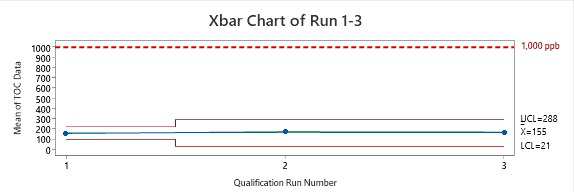
Figure 4: Control Chart of Runs 1 Through 3. The data points plotted are the means of the data collected from each run. As we know from the central limit theorem, these means are equal to the means of the total sample population. From this, we know that the TOC values of all sample sites are well below the acceptance limit of 1,000 ppm of TOC.
Discussion
The examples and simulations above have shown that significant information can be obtained about cleaning processes with only a limited number of samples and qualification runs. As seen in Simulation 2, starting with a larger number of samples in the initial qualification run can provide increased confidence in the performance of the cleaning process and allow the qualification potentially to be scaled back to only one or two performance qualification runs.
There are many who believe in the "magic number three" to demonstrate reproducibility or stability, but the use of continued monitoring of cleaning process parameters (temperature, time, pressure, flow rate, conductivity, etc.) may be more than adequate substitutes for ongoing sampling. Consider Table 5, where the cleaning process parameters are measured and recorded for every cleaning. After the data collected from the first run indicate excellent cleaning results, would different results be expected for the second and third runs knowing that the cleaning process parameters were exactly the same? What results would be expected if the first run was for a new product knowing that the cleaning process had been previously qualified on other products using these parameters?
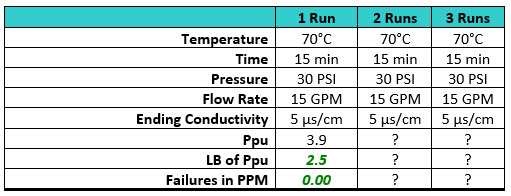
Table 5: Process Capabilities of the Swab Data with Process Parameters
This is a hypothetical proposal so some readers may not be convinced that seeing these results could justify performing only one qualification run. To further make this case, we will examine an actual pharmaceutical manufacturing situation where such a decision was considered justified.
Case Study
A topical pharmaceutical facility that manufactured medicinal shampoos was instituting a cleaning validation program for the first time. A risk assessment/master plan and cleaning validation studies were performed following the concepts in ASTM E31062 and ASTM E3219.5 The risk assessment found the APIs to be of low toxicity, posing a low risk, and identified TOC analysis as an appropriate analytical method for the level of risk in line with the guidance in ASTM E3106. Cleanability studies of the products identified the “hardest-to-clean” products for cleaning performance qualification.
After the risk analysis was complete, cleaning performance qualification protocols were written and TOC data were collected for the cleaning procedures for five manufacturing kettles, two packaging lines, and the raw material pre-weigh area.
The Ppus (LB) calculated from the TOC swab data for the eight cleaning qualification runs were plotted using the process capability scale developed by the ASTM E3106 team. All of the results fell at the bottom of the scale, indicating a very low risk of failures (Figure 5).
Figure 5: Process Capability Report for a Topical Pharmaceutical Facility (kettles, packaging lines, and pre-weigh area). These results indicate a very low probability of cleaning failures.
All of the TOC swab data were then pooled and an overall cleaning process capability calculated. This analysis yielded a lower confidence interval (CI) of 27.62 for the aggregated data, indicating a very low risk of failure for the cleaning processes of the manufacturing equipment (Figure 6).
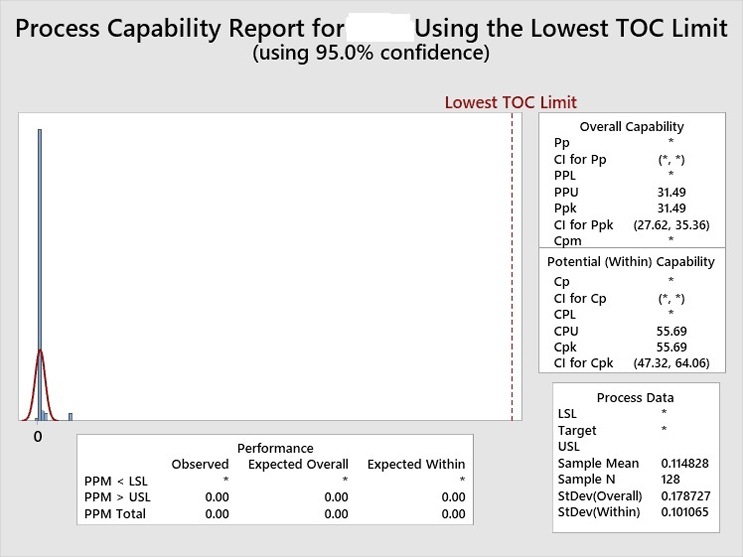
Figure 6: Process Capability Report on the Aggregated TOC Data for the Topical Pharmaceutical Facility
The collected the TOC swab data were also plotted using an Xbar Control Chart. This analysis of data also demonstrates that the product residues for the hardest-to-clean products were consistently controlled well below the lowest TOC limit. The upper control limit (UCL) for all of the TOC swab data was only 487 ppb, meaning that 99.87% of all the TOC swab data fell below this value.
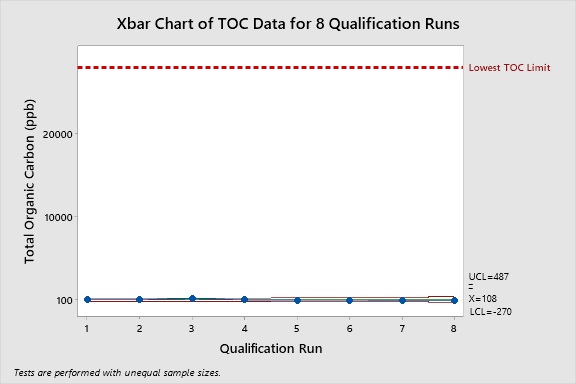
Figure 7: Control Chart of the Pooled TOC Data for the Topical Pharmaceutical Facility
These results were also plotted on the Shirokizawa matrix6 to determine what risk controls7 are recommended. As the data for this case study are over 10 years old, and the Shirokizawa matrix analysis had not yet been developed, this analysis could not be performed at that time. This analysis indicates that the criticality is a 4B/4A.
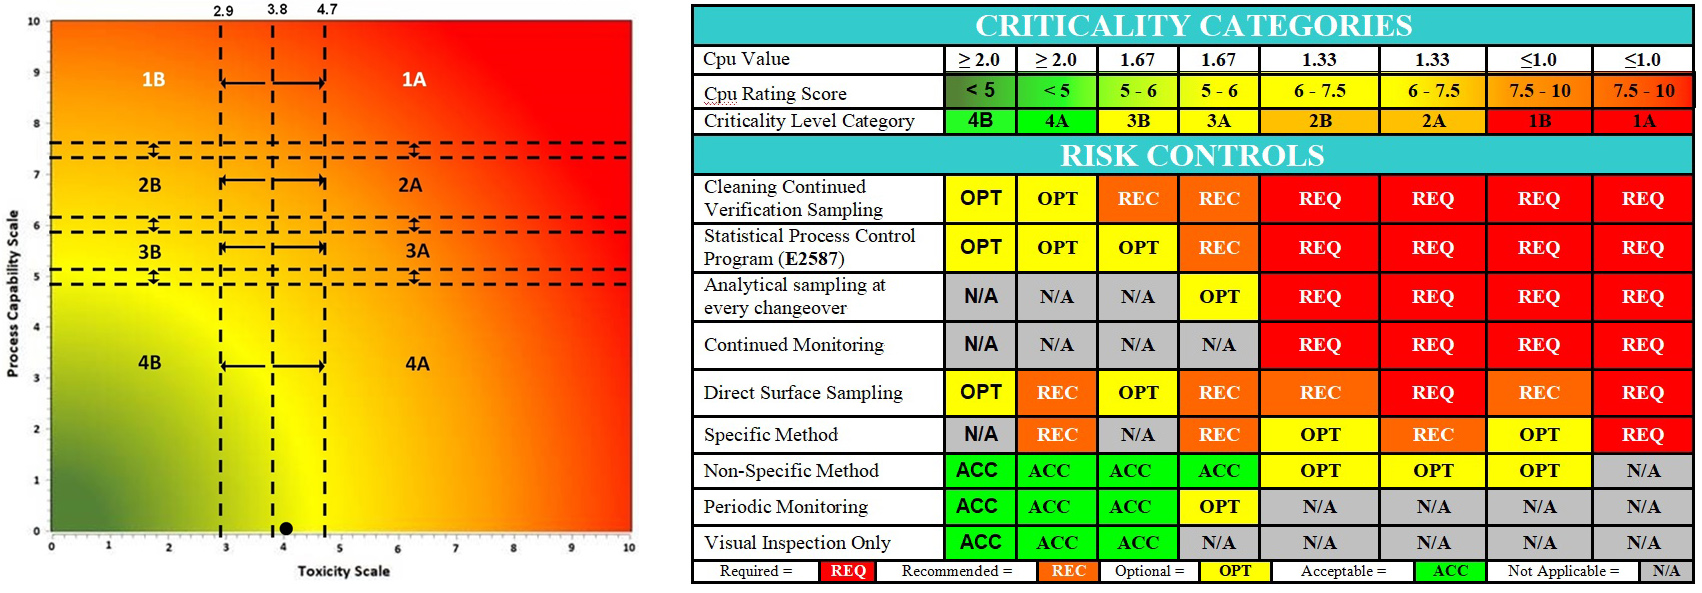
Figure 8: Shirokizawa Diagram for Selecting Criticality6 and E3470 Suggested Risk Controls.7 The Shirokizawa matrix with eight categories (1A – 4B) based on the toxicity score of the compound and the Cpu score of the cleaning process. The black dot (●) marks the intersection of the toxicity and process capability data for the cleaning process of this topical pharmaceutical facility. The location in the 4B/4A quadrant made this facility a strong candidate for replacement of swab sampling with visual inspection as per ASTM E3470.
The statistical evaluation of these data, along with the low hazard level (low toxicity) of the products, revealed that these data satisfied the first and second criteria listed by EMA in its Q&A #7,8 which meant that this facility could be a candidate for implementing visual inspection (Figure 8). This evaluation led to the development of a visual inspection program9 for this facility that is in compliance with the EMA's Q&A #7 and #8 on health-based exposure limits.8
Summary
From this discussion the authors believe the reader should be convinced that:
- Process capability and process performance calculations, based on the means and standard deviations of cleaning samples, can provide important information on the risk of cleaning processes not meeting acceptance limits with a high degree of assurance.
- Multiple qualification runs may not always be necessary to determine the level of risk in cleaning processes. One or two may suffice depending on the level of risk found.
- The case study presents strong arguments for reducing cleaning qualification runs to a level that is objectively/scientifically necessary. The case study also speaks in favor of the implementation of visual inspection programs for cleaning processes with high process capability and process performance.
There is an opinion among some cleaning practitioners that cleaning processes do not cover all the surface areas uniformly, so there are multiple subpopulations in the sampling, and this would make the calculation of process capability inappropriate and invalid. What this viewpoint fails to recognize is that, if this situation is true, and there are multiple subpopulations in the samples, then the cleaning process is clearly inconsistent and unreliable and therefore cannot be validated. There are statistical tools that can be used to evaluate cleaning data to determine if there are such subpopulations. An example is shown in Figure 9 from reference 3. These statistical tools should be used in analyzing cleaning data to identify if data indicate an inconsistent and unreliable process so risk remediation steps can be implemented to improve the cleaning process so that it is consistent and reliable.
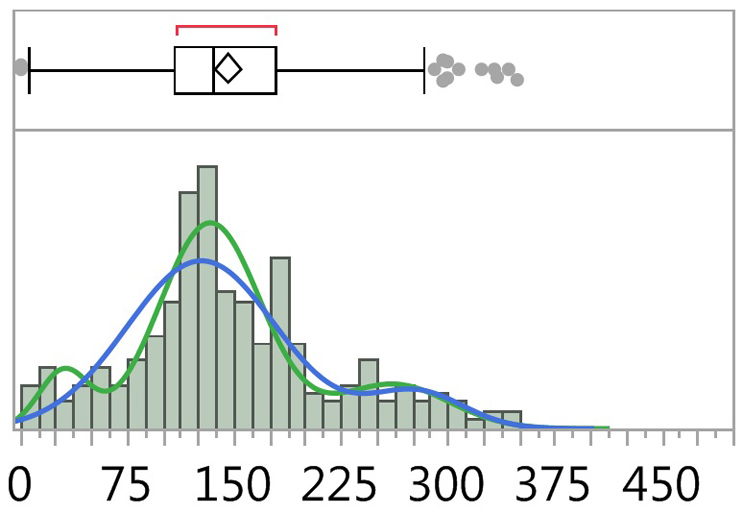
Figure 9: Fitted Normal 2 and 3 Mixture Plots of TOC Data.3 The graph above shows a combination box plot (top) and histogram (bottom) of TOC data from reference 3. Fitted line plots for two mixtures and three mixtures are shown superimposed on the histogram and indicate the possible presence of three normal distributions within the data set (green plot). See reference 3 for a detailed discussion about this data analysis.
The understanding that cleaning process capability can provide a measure of the level of risk also can facilitate the implementation of the second principle of ICH Q9(R1) and justify a "level of effort, formality and documentation commensurate with the level of risk" for the cleaning validation process.10 The knowledge and understanding gained from such cleaning process capability estimates can even be used for justifying simpler analytical methods such as TOC and visual inspection.11,12
Peer Review
The authors wish to thank Sarra Boujelben, Gabriela Cruz, Ph.D., David Dolan, Ph.D., Andreas Flueckiger, MD, Christophe Gamblin, Ioana Gheorghiev, MD, and Basundhara Sthapit, Ph.D., for reviewing this article and for providing insightful comments and helpful suggestions.
References
- Andrew Walsh; Thomas Altmann; Joshua Anthes; Ralph Basile; Alfredo Canhoto, Ph.D.; Stéphane Cousin; Hyrum Davis; Parth Desai; Boopathy Dhanapal, Ph.D.; Jayen Diyora; Igor Gorsky; Benjamin Grosjean; Richard Hall Hall; Ovais Mohammad; Mariann Neverovitch; Rod Parker; Miquel Romero-Obon; Jeffrey Rufner; Siegfried Schmitt, Ph.D.; Osamu Shirokizawa; Steven Shull; Stephen Spiegelberg, Ph.D. and John VanBershot, Cleaning Process Capability - Understanding Populations, Samples and Sample Size Requirements, Pharmaceutical Online, June 2025. https://www.pharmaceuticalonline.com/doc/cleaning-process-capability-understanding-populations-samples-and-sample-size-requirements-0001
- American Society for Testing and Materials (ASTM) E3106 Standard Guide for Science-Based and Risk-Based Cleaning Process Development and Validation, https://store.astm.org/e3106-22.html.
- Walsh, Andrew, Miquel Romero Obon and Ovais Mohammad, Calculating Process Capability Of Cleaning Processes: Analysis Of Total Organic Carbon (TOC) Data, Pharmaceutical Online, January 2022. https://www.pharmaceuticalonline.com/doc/calculating-process-capability-of-cleaning-processes-analysis-of-total-organic-carbon-toc-data-0001
- FDA Guidance for Industry: Process Validation - General Principles and Practices, January 2011, U.S. Food and Drug Administration (FDA), https://www.fda.gov/files/drugs/published/Process-Validation--General-Principles-and-Practices.pdf.
- American Society for Testing and Materials (ASTM) E3219 Standard Guide for Derivation of Health-Based Exposure Limits (HBELs), https://store.astm.org/e3219-25.html.
- Walsh, Andrew, Thomas Altmann, Ralph Basile, Joel Bercu, Ph.D., Alfredo Canhoto, Ph.D., David G. Dolan Ph.D., Pernille Damkjaer, Andreas Flueckiger, M.D., Igor Gorsky, Jessica Graham, Ph.D., Ester Lovsin Barle, Ph.D., Ovais Mohammad, Mariann Neverovitch, Siegfried Schmitt, Ph.D., and Osamu Shirokizawa, The Shirokizawa Matrix: Determining the Level of Effort, Formality and Documentation in Cleaning Validation, Pharmaceutical Online, December, 2019. https://www.pharmaceuticalonline.com/doc/the-shirokizawa-matrix-determining-the-level-of-effort-formality-documentation-in-cleaning-validation-0001
- American Society for Testing and Materials (ASTM) E3470 Standard Guide for Using FMECA and HACCP for Performing Risk Identification, Risk Analysis & Risk Control on Cleaning Processes for Pharmaceuticals and Medical Devices, https://store.astm.org/e3470-25.html.
- European Medicines Agency, Questions and answers on implementation of risk-based prevention of cross-contamination in production and Guideline on setting health-based exposure limits for use in risk identification in the manufacture of different medicinal products in shared facilities, (EMA/CHMP/CVMP/SWP/169430/2012) 19 April 2018, EMA/CHMP/CVMP/SWP/246844/2018.
- Walsh, Andrew, Dongni (Nina) Liu, Mohammad Ovais, Justification and Qualification of Visual Inspection for use in Cleaning Validation for a Low Risk, Multi-Product Facility, Pharmaceutical Online, August 2018. https://www.pharmaceuticalonline.com/doc/justification-qualification-of-visual-inspection-for-cleaning-validation-in-a-low-risk-multiproduct-facility-0001
- International Conference on Harmonization of Technical Requirements for Registration of Pharmaceuticals for Human Use, ICH Harmonized Tripartite Guideline, Quality Risk Management – Q9(R1), Final version adopted on January 18, 2023.
- American Society for Testing and Materials (ASTM) E3263 Standard Practice for Qualification of Visual Inspection of Pharmaceutical Manufacturing Equipment and Medical Devices for Residues, https://store.astm.org/e3263-22e01.html.
- Andrew Walsh, Ralph Basile, Ovais Mohammad, Stéphane Cousin, Mariann Neverovitch, and Osamu Shirokizawa Introduction To ASTM E3263-20: Standard Practice For Qualification Of Visual Inspection Of Pharmaceutical Manufacturing Equipment And Medical Devices For Residues, Pharmaceutical Online, January 2021. https://www.pharmaceuticalonline.com/doc/introduction-to-astm-e-standard-practice-for-qualification-of-visual-inspection-of-pharmaceutical-manufacturing-equipment-and-medical-devices-for-residues-0001