
A Quantitative Benefit-Risk Analysis & Benefit-Risk Ratio Using Real World Data: Part I
By Jayet Moon, Veronica Stephens, and Kylee Rogers

Integrative risk assessments in medical applications involve more than qualitative or quantitative specific line item-based risk assessment of occurrence and severity. The overall risk of the medical therapy (as a drug, medical device, or provided through combination products) must be compared to the overall benefit such that an aggregate metric is generated that can be compared to a baseline metric, thus allowing one therapy to be holistically compared to another. This assessment must also allow the same therapy to be compared for risk factors over a set duration of time or periodically if needed.
Per the classical definition of risk,1,2 two components of risk that are evaluated during risk quantification in medical/therapeutic applications are:
- occurrence or probability (likelihood) of harm upon administration of the therapy and
- consequent severity of the harm during or after administration of the therapy.
To calculate risk, these two inputs are combined (usually by multiplication) and the output is often perceived to be a quantified value of risk. When compared across differing medical therapies, this output may not be deterministic and is affected by uncertainties in the assessment process and uncertainties engendered by non-standard comparison. Moreover, risk is just one dimension of the therapeutic treatment. The classical definition of risk must be expanded to create a measurement that takes into consideration the positive impact of therapy despite the presence of negative risks. To holistically gauge the impact of a therapy, its disease-mitigating benefit must be taken into consideration. The definition of risk (which includes occurrence and severity) is suited to both risk and benefit calculation since it explicitly includes parameters for adjudging seriousness of an event and its incidence. These are two of the three foundational principles of risk-benefit analysis postulated by Edwards (1996).3 The third principle is duration, which is implicitly covered by the gradation of severity and occurrence scales.
Recent regulations from the U.S. FDA4 and the European Union5 stress the importance of benefit-risk calculations in assessing medical outcomes. These and other regulations, while mentioning terms such as risk-benefit and risk-benefit ratio, do not provide any specific methods for the same.
The Council for International Organizations of Medical Sciences6 recommends that for benefit-risk evaluation, the dominant risks must be summarized by seriousness and the relationship should be represented quantitatively and, if possible, diagrammatically. Every medical intervention has some level of probability of injuries associated with it, and a mathematically sound method that objectively classifies this risk level along with a benefit level should be used to determine the risk profiles, which can be compared and contrasted with competing interventions.
In the above context, a method for risk benefit assessment should be able to accomplish the following:
- Compare the benefit-risk profile using the same model for the same therapy with different criteria and different therapies with different criteria.
- Compare preclinical and post-market benefit-risk profiles using the same model and method.
- Provide a numerical aggregate benefit-risk value for baselining and comparison.
- Graphically portray the benefit-risk difference.
- Consider both probability and severity to calculate risks and benefits.
- Use a standardized scale of severities to avoid estimation and assignment errors.
- Explicitly or implicitly incorporate the duration of treatment and adverse events into the analysis.
- Allow for weighing of severities and occurrences as needed.
This article aims to introduce a novel model by taking a bottom-up approach using the risk of the therapy and comparing it to risk of no therapy to quantify risk and benefit with the same scale. The benefit, according to the method detailed in this paper, is tantamount to the degree to which the therapy has decreased the risk of illness. Gaylor (2005)7 has used a similar double negative meaning of benefit for calculation of risk-benefit as it relates to microbial exposure and disinfectant toxicity-caused illness. Similarly, Oka (2001)8 has used the double negative definition of benefit for ecological benefit-risk analysis.
The Clavien Dindo Classification Scheme
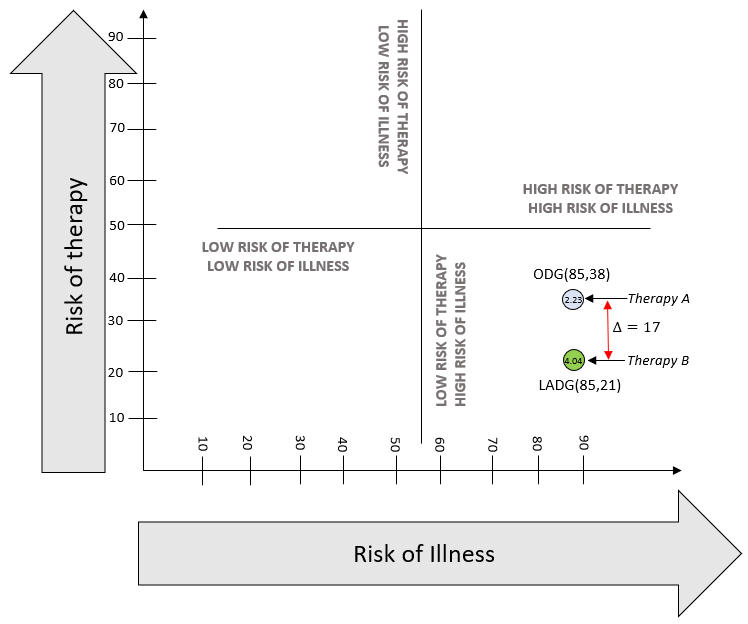
On a macro level, high-risk therapy could be justified when there is higher risk of complications from illness, including mortality. The framework shown in Figure 1 can help locate the profile of any disease. Using Figure 1, the spectrum of benefit-risk in terms of risks of therapy and risks of illness without therapy can be plotted for any disease, and this is our end goal. This is a simple four-way division based on binary high-low states of risk of therapy and illness. This figure does not quantitatively display a benefit-risk balance curve or thresholds. To use the figure, a calibration will be necessary by plotting a point for baseline comparison.
The semi-quantitative method in this article to analyze benefit-risk can be used to plot the benefit-risk score, compare two therapies, or compare a therapy to a baseline by using the Clavien Dindo scale as the severity scale for harms classification.
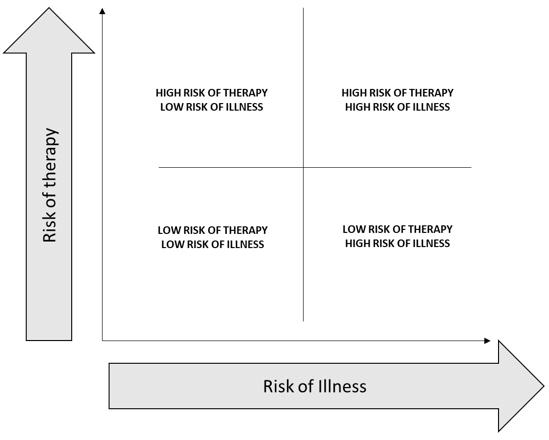
Figure 1: Risk of Therapy vs. Risk of Illness
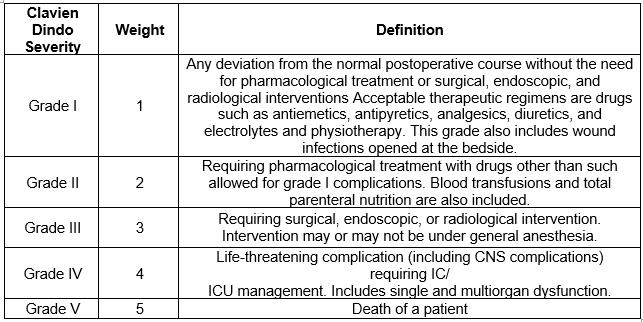
The Clavien Dindo classification is a scheme of graded harm-based classifications of surgical complications that has been demonstrated to be of significant value in comparing surgical outcomes.9,10 Multiple publications have used this scheme to prove objective difference in degree of surgical harms based on comparative therapies.10,11,12 However, there is scope for further research and exploration of the applicability of this harm-based classification to standard risk assessment tools, especially, risk matrices that combine risk likelihoods (occurrence) and severities (consequence) to assign risk levels.
The Clavien Dindo severity scale, along with the relevant definitions for the grades of harm, is shown in Table 1.
Table 1: Clavien Dindo Severity Scale
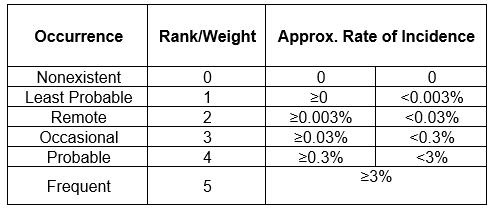
A custom frequency scale has been developed as shown in Table 2.
Table 2: Probability Scale
The Clavien Dindo Risk Matrix, where severity scales are represented by the Clavien Dindo grades of harm, is shown in Table 3.
Table 3: Clavien Dindo Risk Matrix
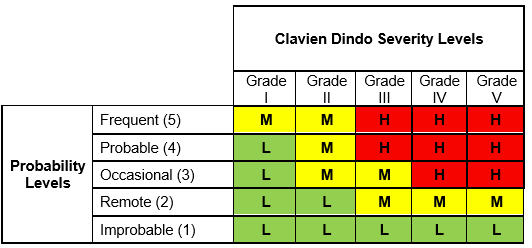
The output risk index in this matrix can take three values:
- High (H)
- Medium (M)
- Low (L)
The basis for a risk matrix is the definition of risk itself which, as defined earlier, is the combination of the of occurrence (likelihood) of harm and the severity of that harm. Thus, the combination of these two input variables leads to the single output variable of risk which, according to its assigned value, is classified as High, Low, or Medium. The logic used in this risk calculation is simple, as shown below12:
IF probability of Occurrence is O AND Severity is S, THEN risk is R.
The Risk Equation
Risk R, in its most simple form is:
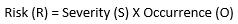
(Equation 1)
This relationship gives equal weights to both parameters of probability of occurrence and severity. For medicinal applications, the severity relationship may not be linear since the value of the severity parameter is much higher. As a result, this formula must be modified. The seminal Australian standard HB 436: 2004 : Risk Management Guidelines13 gives the following formula (Equation 2):
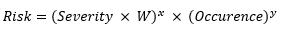
(Equation 2)
Here, W is the weighting factor.
For purposes of this study, W =2, x= 2, and y=1.
variables should be the degree of resolution needed in the spectrum of risk calculations. The maximum level of severity and occurrence per the five level scales defined in this paper is 5. Hence, the lowest level of risk product per Equation 2 is 4, while the highest is 500. In this case, if we had chosen W=2, x=3, and y=1, the lowest level of risk would have been 8 and the highest would have been 5,000, producing a ten-fold increase in risk range.
For the benefit-risk model, this formula of risk shall be used for calculation of both risk of therapy and risk of Illness without therapy. Overall risk is composed of risk clusters of adverse events. These clusters are shown as risk factors A, B, C, D, and E for the risk of therapy and A’, B’, C’, D’, and E’ for the risk of illness without therapy. The basis for clustering of these risks is the severity level of adverse events, which is categorized by the Clavien Dindo grade. Since there are five grades in this study, five risk clusters have been identified.
Each of these risks is compiled from constituent risk factors derived from the Clavien Dindo grades as shown below.
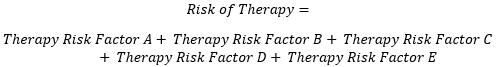
(Equation 3)
(Equation 4)
These risk factors are resolved per the Clavien Dindo severity grades as shown in the model detailed in Figure 2.
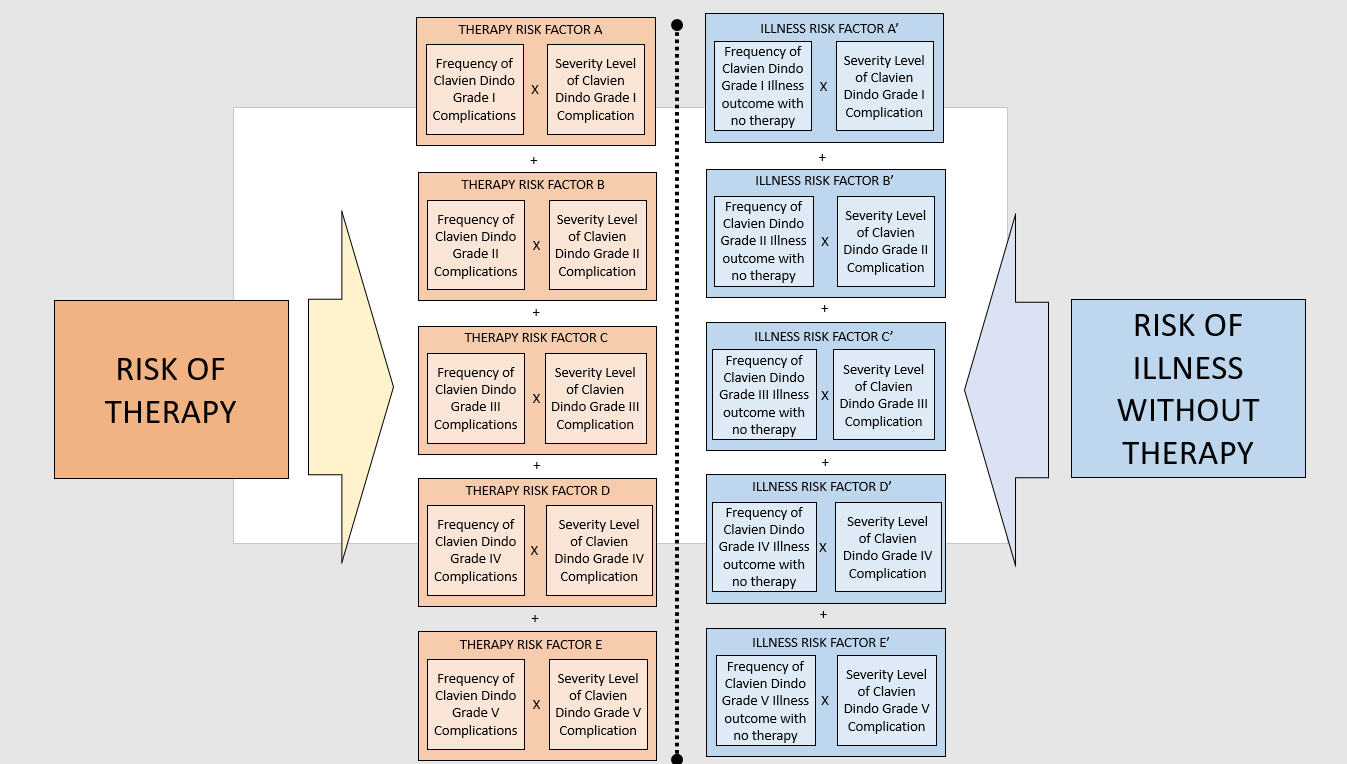
Figure 2: Clavien-Dindo Grades Based Risk Factors Model for Risk Benefit Analysis. Click figure image to enlarge.
The mathematical conversion of this model can be realized by using Equation 2 as follows:
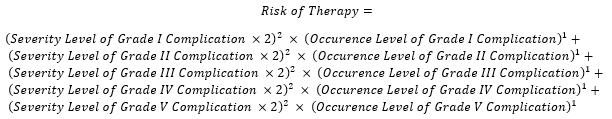
(Equation 5)
This can be mathematically represented as:
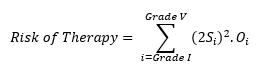
(Equation 6)
Thus, the risk of therapy comprises the individual risk levels of each of the Clavien Dindo harms (outcomes). To calculate this, the clinical endpoint or events must be graded per the Clavien Dindo grades shown in Table 2 and assigned an occurrence level per Table 3. Then these numbers must be applied to the formula above for all grades of harms to obtain the aggregate risk.
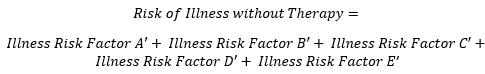
Similarly, the risk of Illness without therapy is the sum of illness risk factors shown in Figure 2 and can be mathematically represented as:
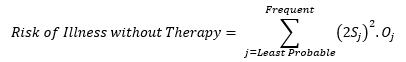
(Equation 7)
The risk of illness without therapy is the risk level of the probability of each Clavien Dindo grade outcome without treatment. To calculate this, events from least probable to frequent must be categorized in terms of the Clavien Dindo grade per Table 2. For example, if a patient has a flu, it’s least probable that a Grade V event will occur, and it is frequent that a Grade I event will occur.
Finally, the benefit-risk ratio can be shown as:

The risk score and the benefit-risk ratio just calculated can be used to compare two therapies using Figure 1. An example is shown below, which compares complications from gastrectomies using two therapies, open distal gastrectomy (ODG) and laparoscopically assisted distal gastrectomy (LADG). The data used for comparison is from Lee et al (2012).14
Similar examples will be explored in the next part of this series. More details about this and other methods of benefit-risk analysis can be found in the book Foundations of Quality Risk Management.15
References
- Aven, T. (2009). Safety is the antonym of risk for some perspectives of risk. Safety science, 47(7), 925-930.Benefit-risk balance for marketed drugs. (2004). Geneva: CIOMS. ISBN 92 9036 068 2
- ISO (2007), Application of risk management to medical devices (14971: 2007) Retrieved from https://www.iso.org/standard/38193.html
- Edwards, I. R., Wiholm, B. E., & Martinez, C. (1996). Concepts in risk-benefit assessment. Drug safety, 15(1), 1-7.
- Center for Devices and Radiological Health. (2019, August 29). Benefit-Risk Determinations in Medical Device PMAs and De Novos. Retrieved November 11, 2019, from https://www.fda.gov/regulatory-information/search-fda-guidance-documents/factors-consider-when-making-benefit-risk-determinations-medical-device-premarket-approval-and-de.
- Lex Access to European Union law. (2017, April 5). Retrieved November 1, 2019, from https://eur-lex.europa.eu/eli/reg/2017/745/oj.
- CIOMS Working Group IV. (1998) Benefit–risk Balance for Marketed Drugs. Retrieved from https://cioms.ch/wp-content/uploads/2017/01/benefit-risk.pdf
- Gaylor, D. W. (2005). Risk/benefit assessments of human diseases: optimum dose for intervention. Risk Analysis: An International Journal, 25(1), 161-168.
- Oka, T., Matsuda, H., & Kadono, Y. (2001). Ecological risk–benefit analysis of a wetland development based on risk assessment using “expected loss of biodiversity”. Risk Analysis, 21(6), 1011-1024.
- Clavien, P. A., Barkun, J., De Oliveira, M. L., Vauthey, J. N., Dindo, D., Schulick, R. D., ... & Graf, R. (2009). The Clavien-Dindo classification of surgical complications: five-year experience. Annals of surgery, 250(2), 187-196.
- Dindo, D. (2014). The Clavien–Dindo classification of surgical complications. In Treatment of postoperative complications after digestive surgery (pp. 13-17). Springer, London.
- Yoon, P. D., Chalasani, V., & Woo, H. H. (2013). Use of Clavien-Dindo classification in reporting and grading complications after urological surgical procedures: analysis of 2010 to 2012. The Journal of urology, 190(4), 1271-1274.
- Ni, H., Chen, A., & Chen, N. (2010). Some extensions on risk matrix approach. Safety Science, 48(10), 1269-1278.
- AS/NZS HB436: 2004. Risk management guidelines. Standards Australia and Standards New Zealand, 2004
- Lee, J. H., Park, D. J., Kim, H. H., Lee, H. J., & Yang, H. K. (2012). Comparison of complications after laparoscopy-assisted distal gastrectomy and open distal gastrectomy for gastric cancer using the Clavien–Dindo classification. Surgical endoscopy, 26(5), 1287-1295.
- https://asq.org/quality-press/display-item?item=H1578
About The Authors:
 Jayet Moon earned a master’s degree in biomedical engineering from Drexel University in Philadelphia and is a Project Management Institute (PMI)-Certified Risk Management Professional (PMI-RMP). Jayet is also a Chartered Quality Professional in the UK (CQP-MCQI). He is also an Enterprise Risk Management Certified Professional (ERMCP) and a Risk Management Society (RIMS)-Certified Risk Management Professional (RIMS-CRMP). He is a Fellow of the International Institute of Risk & Safety Management. His new book, Foundations of Quality Risk Management, was recently released by ASQ Quality Press. He holds ASQ CQE, CQSP, and CQIA certifications.
 Veronica Stephens is the senior vice president of quality and risk management solutions for the firm Auchincloss-Stephens. She is a risk management subject matter expert with over two decades of experience in Fortune 500 companies across a range of industries, including pharmaceuticals, food production, consumables, durables, and medical devices.
 Kylee Rogers is the owner and founder of Intuitive Quality Consulting, providing risk assessments and product specification recommendations for infant and juvenile products. She is also a supplier quality professional with Young Living. With a CQA and a CSQP with the American Society for Quality, her background is in nutrition, dietary supplements, and OTC products. She serves as a co-chair for the ASQ Global NextGen Advocacy Sub-Committee and as arrangements chair for her local chapter. She predicts receiving her B.S. in business management in the spring of 2022.