
A Comparison Of 6 Analytical Validation Guidelines Using Data Envelopment Analysis
By Bilel Khedir, Galien Pharmaceuticals

Poorly validated or inadequately characterized analytical methods are like setting out on an unfamiliar journey across the Atlantic without a map; you may eventually reach your destination, but at considerable risk. On the other hand, overly burdensome validation procedures can feel like racing in Formula 1 with an underpowered car: you will finish, but far too late to matter.
This article presents the first published application of Data Envelopment Analysis (DEA) to six major pharmaceutical analytical validation guidelines: ICH Q2(R2) (which reflects U.S. FDA and EMA perspectives), U.S. Pharmacopeia ⟨1225⟩, Chinese Pharmacopeia 9101, JFDA 2021 (Jordan Food and Drug Administration), ANVISA RDC 166/2017 (Brazil), and SFSTP 1992 (French scientific Community Société Française des Sciences et Techniques Pharmaceutiques) across the five universally mandatory validation criteria. The analysis quantifies how efficiently each guideline uses experimental resources to achieve the same validation objective, identifies the specific regulatory choices that drive each efficiency gap, and translates those gaps into concrete resource costs.
The Challenge: One Objective, Six Different Answers
Every pharmaceutical analytical validation guideline in existence shares a single stated objective: to demonstrate that an analytical procedure is fit for its intended purpose. Yet from this common starting point, six major regulatory frameworks have developed markedly different experimental designs and statistical requirements for the same five mandatory criteria: specificity, linearity, accuracy, precision (repeatability), and intermediate precision.
These five criteria are the only validation parameters universally mandated across all six guidelines compared in this analysis. Robustness, limit of detection, and limit of quantification differ in mandatory status between methods (assay vs. related substances, number of impurities) and are therefore excluded from the comparison scope. This is not a methodological convenience; it is a prerequisite for a fair comparison: every guideline must produce the same output.
The practical differences are stark. A laboratory validating a small molecule HPLC assay under ICH Q2(R2) prepares 23 analytical samples.1 Under SFSTP1992, the same validation requires 98.2 This is not merely an academic curiosity; every unnecessary preparation consumes analyst time, reference standards, drug substance, and instrument capacity. In a competitive environment, the cumulative effect of regulatory inefficiency compounds across an entire portfolio.
Measuring Regulatory Efficiency: Data Envelopment Analysis
Data envelopment analysis (DEA), introduced by Charnes, Cooper, and Rhodes in 1978, is a nonparametric linear programming method for measuring the relative efficiency of decision-making units (DMUs) that transforms inputs into outputs. Unlike simple ratio comparisons, DEA identifies a best practice frontier from the actual data without imposing assumptions about the shape of the production function. A DMU on the frontier scores θ* = 1.000 (100% efficient); inefficient DMUs score less than 1, with the score representing the proportion of current input they would need if they operated as efficiently as the frontier.3,4
The model uses a single composite input (I₁/I₂) and uniform output (O₁):
- I₁ = total analytical sample preparations required for the five mandatory criteria
- I₂ = total mandatory statistical tests/acceptance evaluations — counted strictly from primary guideline text. Acceptance thresholds (r ≥ 0.999, RSD < 2%) are not tests; they are limits applied to the same procedure.
- O₁ = 5.00 for all six guidelines identical output for identical coverage. This eliminates subjective scoring entirely.
With one input and one output, the efficiency formula simplifies to θ* = (I₁/I₂)_best ÷ (I₁/I₂)_DMU. With six guidelines (n=6) and m=1, s=1, the Golany-Roll rule of thumb requires n ≥ max(1, 6) = 6 exactly satisfied, giving the model adequate discriminant power.
I verified every I₂ value directly against primary guideline text: ICH Q2(R2) 2022, USP ⟨1225⟩ (USA), ChPharmacopeia (China), ANVISA RDC 166/2017(Brazil), JFDA Rev 00 2021 (Jordan), and SFSTP 1992 (France).
Results: Three Guidelines, One Optimal Design
Table 1 presents the complete data matrix. The range is striking: from a frontier ratio of 2.875 (ICH/USP/ChP) to 7.000 (SFSTP) — a 2.4-fold difference in preparation intensity for the same five mandatory criteria, the same output.1,2,5,6,7,8,9,10
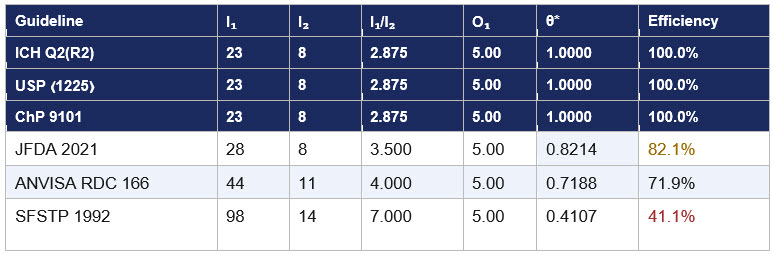
Table 1: DEA efficiency scores — 5 mandatory criteria, input-oriented CCR model.
I₁ = preparations, I₂ = mandatory statistical tests, O₁ = 5.00 uniform for all DMUs. Frontier ratio = 2.875. θ* = 2.875 ÷ (I₁/I₂)_DMU.
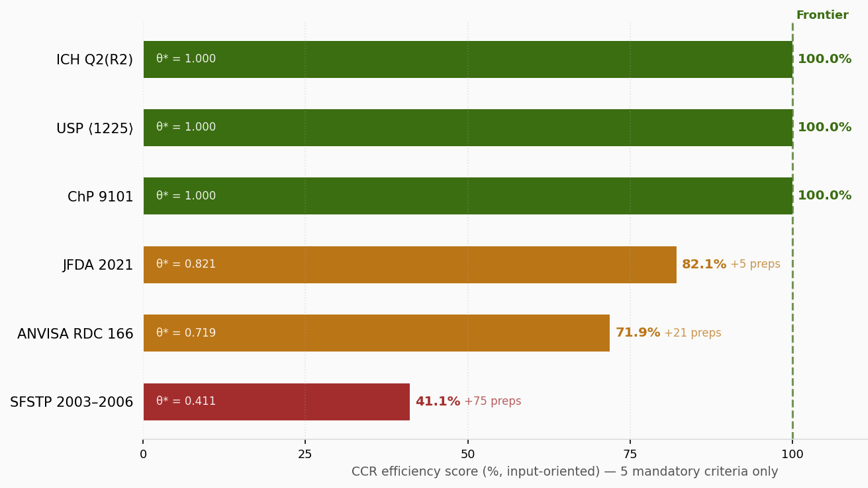
Figure 1: CCR efficiency scores — 5 mandatory criteria only.
Green = efficient frontier (θ*=1.000). Amber = moderately inefficient. Red = highly inefficient. Values inside bars show θ*; values to the right show extra preparations relative to the frontier.
The most significant result is that ICH Q2(R2), USP ⟨1225⟩ revised, and ChP 9101 are jointly efficient at θ* = 1.000. All three share an identical experimental design: five-level linearity with two preparations reused for accuracy and three reused for precision. These guidelines were not developed in coordination. The revised USP ⟨1225⟩ adopted the combined approach in alignment with ICH Q2(R2) 2022. ChP 9101 harmonized independently in its 2020 edition. Three of the world's four largest pharmacopeial authorities covering the international community, the United States, and China— arrived at the same topological solution because it is objectively the most efficient way to gather the five required types of evidence simultaneously.5,6
What The Efficiency Gap Means In Practice
Efficiency scores are useful to academics. What matters to a quality director or a regulatory affairs professional is what those scores mean in the laboratory, on a Monday morning. Table 2 translates the gaps into plain-language resource costs.
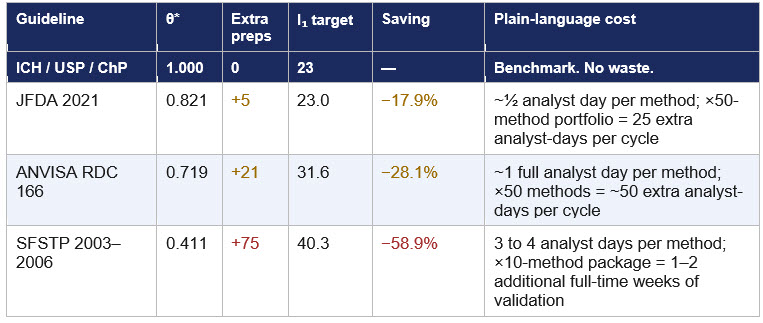
Table 2: Efficiency gaps translated into concrete resource costs.
Extra preparations relative to the frontier (23 preps). Analyst day estimate assumes 20 to 40 minutes per preparation (active work).
JFDA 2021 82.1%: A Single Regulatory Update Away From The Frontier
The JFDA guideline scores 82.1%, representing a gap of 17.9 percentage points from the frontier. The guideline is based on ICH Q2(R1) rather than the 2022 revision and does not authorize the combined accuracy–precision approach. This means JFDA requires nine independently prepared accuracy samples and six independently prepared precision samples,8 versus the seven and three achievable under the Q2(R2) overlap design, adding five preparations per validation.1
The improvement target is the smallest of all three inefficient DMUs and the most achievable: a single regulatory update aligning the guideline reference from ICH Q2(R1) to ICH Q2(R2) 2022. The JFDA is an ICH observer at the time of the ICH Q2 (R2) guideline. The quantified cost of not implementing this update is five additional preparations and approximately half an analyst day per validation for every small molecule HPLC assay validated in Jordan under this guideline.
Note on JFDA guideline version: The JFDA guideline used is Rev 00 – August 2021, the only publicly available version at the time of writing. A subsequent revision may have been issued. Readers should verify the current version with the JFDA directly. If a later revision authorizing the combined approach exists, JFDA's efficiency score and gap calculation would change accordingly.
ANVISA RDC 166 71.9%: The Cost Of Independence, And A Signal Worth Watching
ANVISA RDC 166/2017 scores 71.9%. Article 44 mandates that accuracy samples "must be prepared independently, since the beginning of the procedure," and Article 36 §1 prohibits diluted solutions from the same stock solution for precision. These requirements add 21 preparations relative to the ICH overlap design, raising the composite ratio from 2.875 to 4.000.9 On a 50-method analytical portfolio, that translates to roughly 50 additional analyst-days per validation cycle, a tangible and recurring resource cost.
The scientific intent of the independence requirement is legitimate: it prevents analytical correlation between accuracy and linearity measurements. The DEA model does not argue this intent is wrong; it quantifies the cost of implementing it. Permitting the linearity–accuracy overlap for small molecule drug product assays as ICH, USP, and ChP permit with scientific justification would recover 12.4 preparations per method and close 60% of the efficiency gap.1,5,6
More significantly, ANVISA is in advanced discussions regarding alignment with the ICH Q2(R2) community. Should this alignment materialize and Article 44's independence requirement be relaxed for assay validations, ANVISA's score would move substantially toward the frontier. For multinationals and contract organizations operating across both Brazilian and ICH jurisdictions, this would eliminate one of the most burdensome regulatory differences they currently navigate. Monitoring this alignment process should be a priority for regulatory affairs professionals.
SFSTP 41.1%: Scientific Depth At A Measurable Cost
SFSTP 1992 scores 41.1%, the lowest of the six guidelines. The score is driven almost entirely by the dual-matrix linearity design: five concentration levels × three replicates × three days × two matrices = 90 preparations,2 compared to five for ICH.1 This single design choice accounts for 91.8% of SFSTP's total preparation count and produces a 58.9 percentage point gap from the frontier.
A low DEA score is not a verdict on scientific quality. The SFSTP framework introduced the accuracy profile concept and the β-expectation tolerance interval tools now incorporated into ICH Q2(R2) 2022 and EP Chapter 5.26. The framework provides a richer statistical picture than any other guideline in this comparison. What the model measures is resource efficiency for a defined output; what the SFSTP provides is additional output beyond that definition, which the current model correctly cannot capture.
Note on SFSTP provenance: The SFSTP framework used in this analysis is drawn from Commission SFSTP (1992), published in STP Pharma Pratiques 2(4):205–239, 1992. This document, now more than three decades old, remains the foundation of the SFSTP validation framework in French-speaking regulatory environments. Its persistence reflects the value of its statistical tools, not the efficiency of its experimental design.
Looking Forward: The Harmonization Trend
The analysis reveals a clear directional trend: the global pharmacopeial community is converging on ICH Q2(R2)'s experimental architecture. USP ⟨1225⟩ has aligned. ChP 9101 has harmonized. ANVISA is in discussions. If JFDA updates its reference from Q2(R1) to Q2(R2), and if ANVISA's Article 44 is amended for small molecule assays, the next version of this analysis may show four or five guidelines on the efficient frontier, a remarkable outcome for regulatory harmonization in analytical science.
A laboratory validating under any of the three frontier guidelines today — ICH, USP, or ChP — is already operating at the maximum efficiency achievable for the five mandatory criteria. Any additional experimental work either serves a different purpose (robustness is the clearest example and should be evaluated as a separate dimension) or reflects deliberate scientific conservatism that the laboratory has chosen to invest in. Both are legitimate. What the model provides is visibility: the ability to see, quantify, and explain where resource investment is driven by regulatory design rather than scientific necessity.
A Deeper Question: Same Objective, Different Destinations?
This analysis raises a question that goes beyond efficiency scores and regulatory burden into the epistemology of analytical validation itself.
The objective of analytical validation is universal: every guideline in this comparison states it in the same words or close equivalents. And yet from this single shared objective, the world's regulatory authorities have generated designs that differ by a factor of four in experimental burden and statistical frameworks that range from a single %RSD to a full dual-matrix variance decomposition with β-expectation tolerance intervals.
Consider the practical consequence. A laboratory validates a method under ICH Q2(R2) using 23 preparations and eight mandatory statistical evaluations. A second laboratory validates the same method under SFSTP 1992 using 98 preparations and 14 statistical evaluations. Both pass their respective criteria. Both are declared fit for purpose.
The asymmetry, however, runs in only one direction. A method validated under SFSTP — the more demanding framework — will almost certainly pass ICH acceptance criteria, because the SFSTP framework is a strict statistical superset of ICH's. The reverse is not guaranteed. A method declared fit under ICH's combined design may not pass SFSTP1992because that tool is a more demanding acceptance decision than ICH's confidence interval on mean recovery, and the dual-matrix design assesses matrix effects that the single-matrix design does not.
This asymmetry matters. It implies that these guidelines are not merely different paths to the same destination; they are, to some degree, different destinations. A method demonstrably fit under SFSTP1992 is fit under a richer definition of "fit for purpose" than one validated under ICH alone.
None of this invalidates the DEA model, the efficiency analysis, or the case for harmonization. Efficiency is a legitimate and important dimension of regulatory quality. But efficiency is not the same as adequacy, and adequacy is not the same as equivalence across frameworks. The industry, regulators, and pharmacopeial authorities would benefit from an explicit, evidence-based conversation about whether the frontier design, elegant and optimal as it is, captures everything that validation is meant to demonstrate. The SFSTP tradition, despite its experimental burden, may have been asking that question since 1992.
The efficient design is not necessarily wrong. But “efficient” and “sufficient” are not synonyms — and the difference between them is a conversation the field has not yet finished having.
References
- ICH Q2(R2): Validation of Analytical Procedures. Step 4, November 2022. ich.org
- Commission SFSTP. Guide de validation analytique. STP Pharma Pratiques. 1992;2(4):205–239.
- Charnes, A., Cooper, W. W., & Rhodes, E. (1978). Measuring the efficiency of decision making units. European Journal of Operational Research, 2(6), 429–444.
- Golany, B., & Roll, Y. (1989). An application procedure for DEA. Omega, 17(3), 237–250.
- US Pharmacopeia ⟨1225⟩ Validation of Compendial Procedures. Pharmacopeial Forum 51(6), 2025.
- Chinese Pharmacopeia Commission. Guideline 9101. Chinese Pharmacopoeia 2020 Edition. Beijing: NMPA; 2020.
- Elumalai, S., Dantinapalli, V. L. S., & Palanisamy, M. (2024). Comparative Analysis of Analytical Method Validation Requirements Across ICH, USP, ChP and ANVISA: A Review. Journal of Pharmaceutical Research International, 36(12), 54–71
- Jordan Food and Drug Administration. JFDA Guidelines for Validation of Analytical Procedures. Rev 00 – August 2021. [Note: latest version should be verified with JFDA directly.]
- Brazilian Health Regulatory Agency (ANVISA). (2017). Resolução RDC nº 166, de 24 de julho de 2017 [Collegiate Board Resolution No. 166 of July 24, 2017]. Brasília: ANVISA.
- European Pharmacopeia Commission. Chapter 5.26. Ph. Eur. 10th Ed. EDQM; 2020.
About The Author:
 Bilel Khedir is a Qualified Person at Galien Pharmaceuticals, where he leads GMP compliance, regulatory affairs, and pharmaceutical development for oral solid dosage forms and dietary supplements. He holds a Doctor of Pharmacy (PharmD), an MSc in drug development from the Faculty of Pharmacy Monastir, and an MSc in business analytics from Tunis Business School. His expertise spans regulatory strategy and MA submissions, industrial scale-up and tech transfer, analytical method validation (ICH Q2), cleaning validation, and GMP oversight in compliance with ANMPS (Agence Nationale des Medicaments Tunisia) requirements. He is a member of ISPE and a 2024 ISPE Professional Development Grant recipient. His previous roles include pharmaceutical development project manager and quality assurance pharmacist at Opalia Recordati, and validation specialist at Teriak. He can be reached at bilelbilelkhedir@gmail.com.