
Process Characterization: The Foundation For Validation
By Mark Durivage, Quality Systems Compliance LLC
Process characterization is the foundation for process validation activities. Too often, validation activities fail due to the lack of process characterization using sound statistical and scientific methods, including design of experiments (DOE). In a recent FDA Warning Letter,1 the agency found:
1. Your firm failed to follow written procedures for production and process control designed to assure that the drug products you manufacture have the identity, strength, quality, and purity they purport or are represented to possess (21 CFR 211.100(b)).
Your firm did not appropriately follow your written and approved process validation (PV) protocol which required quality attributes to be met for “three consecutive” batches to qualify an alternate active pharmaceutical ingredient (API). Several PV batches using a new alternate API were manufactured for Losartan Potassium Tablets USP 50 mg and USP 100 mg without appropriately following your protocol.
Specifically, after the first of the three PV batches failed for dissolution, assay, and (b)(4), your firm added a fourth batch which was outside of your written protocol. However, the fourth batch also failed specifications for dissolution. Multiple out-of-specification (OOS) investigations were initiated and quality rejected all four PV batches.
You developed a new interim protocol to justify commercial use of the alternate API and circumvented your original protocol, even though you had data demonstrating your process was not capable of producing quality material using the new alternate API.
It is obvious the firm did not do its homework and characterize its process prior to executing the process validation.
Design Of Experiments
Design of experiments (DOE) is a powerful statistical tool. The English statistician Sir Ronald A. Fisher pioneered its development in the 1920s and 1930s, applying statistical techniques in the study of agriculture. During the 1940s, Robin L. Plackett and J. P. Burman introduced the idea of using smaller, more economical designs for experimentation (fractional factorials). The 1950s saw the introduction of response surface methodology (RSM), used in industrial experimentation by George E. P. Box and K. B. Wilson. During the same period of time, Genichi Taguchi introduced methods for improving the quality of manufactured goods, applying the loss function and signal-to-noise ratios to experimentation.2
Production processes take independent input(s) (X) that provide added value, resulting in dependent output(s) (Y). The independent input(s) of a process are also referred to as factors. The dependent output(s) of a process are also referred to as responses. The inputs/factors can be the materials or process settings such as time, temperature, pressure, etc.
Every output/response demonstrates variation. This variation results from variation in the known process variables, variation in the unknown process variables, and/or variation in the measurement of the response variable. DOE can help effectively characterize the process (i.e., determine the significant few inputs/settings from among the trivial many inputs/settings).
The objectives of a DOE are to learn how to:
- Maximize the output/response
- Minimize the output/response
- Adjust the output/response to a nominal value
- Reduce process variation
- Make the process robust
- Determine which inputs/factors are important to control
- Determine which inputs/factors are not important to control
DOE simultaneously studies several process variables. By combining several variables in one study instead of creating a separate study for each, the amount of testing required is drastically reduced, and greater process understanding will result. This is in direct contrast to the typical one-factor-at-a-time (OFAT) approach, which limits understanding and wastes data. Additionally, OFAT studies cannot be assured of detecting the unique effects of combinations of factors, otherwise known as interactions.
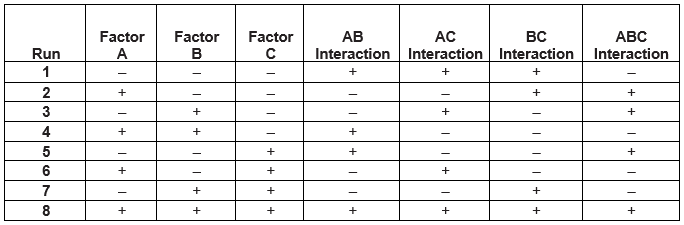
DOEs are displayed as Nn, where N is the number of levels/settings and n is the number of factors that determines the number of runs necessary to conduct the experiment. For example, 23 has 3 inputs/factors and two levels/settings, requiring 2x2x2 = 8 runs. Table 1 provides an example of a 23 experimental design with three factors at two levels (-, +) requiring eight runs. The -, + settings can represent a low and high setting or specific numerical values such as 125ᴼ and 175ᴼ.
Please note this is referred to as a full factorial experiment. There are many types of experimental designs which will not be discussed in this article. The reader is encouraged to explore some of the other experimental designs.
Table 1: Example 23 Experimental Design
Analyzing The Outputs
Once the experiment is executed; the results must be analyzed. Statistical and graphical methods can be used to determine which factors are significant. As shown in Figure 1, if the line is horizontal, the factor is not significant. In other words, there is no appreciable difference in using the low or high setting. The greater the slope, the more significant the effect.
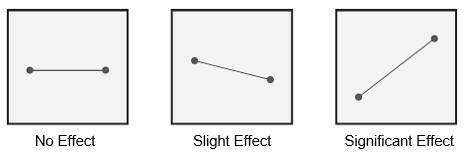
Figure 2: Input/factor significance
DOE can also detect interactions between factors. As shown in Figure 2, if the lines are horizontal, there is no interaction between the factors. When the factor effects intersect, this indicates there is a significant interaction between the variables.
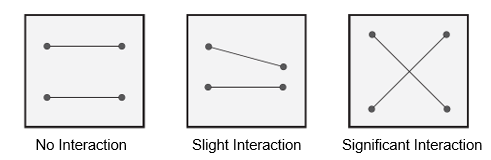
Figure 2: Input/factor significance with input/factor interaction
Once the DOE has been executed and analyzed, the process can be characterized and the information used as the foundation to perform validation activities with a high level of confidence.
Conclusion
The process validation failures cited in the FDA Warning Letter could have and should have been easily avoided if the firm had taken the time to perform a DOE to characterize the process. Not doing that homework cost the organization in direct costs of nonconformances, validation failures, and recalls as well as indirect costs of compliance failure, remediation, and negative regulatory exposure.
Process validation should never be performed until the process is fully characterized. A failed process validation should be a rare event; otherwise, a Warning Letter will probably be in your future. Remember, the cost of a DOE is significantly less than the cost of a Warning Letter and the subsequent remediation.
References:
- https://www.fda.gov/inspections-compliance-enforcement-and-criminal-investigations/warning-letters/torrent-pharmaceuticals-limited-585255-10082019
- Durivage, M.A., 2014, Practical Engineering, Process, and Reliability Statistics, Milwaukee, ASQ Quality Press
- Durivage, M.A., 2016, Practical Design of Experiments (DOE), Milwaukee, ASQ Quality Press
- Durivage, M.A. and Mehta, B., 2016, Practical Process Validation Milwaukee, ASQ Quality Press
About The Author:
 Mark Allen Durivage has worked as a practitioner, educator, consultant, and author. He is managing principal consultant at Quality Systems Compliance LLC, an ASQ Fellow, and an SRE Fellow. He earned a BAS in computer aided machining from Siena Heights University and an MS in quality management from Eastern Michigan University. He holds several certifications, including CRE, CQE, CQA, CSQP, CSSBB, RAC (Global), and CTBS. He has written several books available through ASQ Quality Press, published articles in Quality Progress, and is a frequent contributor to Life Science Connect. Durivage resides in Lambertville, Michigan. Please feel free to email him at mark.durivage@qscompliance.com or connect with him on LinkedIn.