
Mutation Detection Using Multi-Color Detection on the LightCycler System
Astrid Reiser, Maria Geyer, Rob van Miltenburg , Markus Nauck*, and Karim Tabiti, Roche Molecular Biochemicals/Roche Diagnostics Corporation
Contents
Introduction
Experimental Approach
Results
Discussion
References
Introduction (Back to Top)
The LightCycler System is a powerful tool for amplifying and quantitating PCR products in a very short time (Wittwer et al. 1997). By using melting curve analysis, the system also provides a unique and innovative approach for the detection of single nucleotide polymorphisms (Lay et al. 1997). The melting curve analysis monitors the temperature-dependent hybridization of hybridization probes to single-stranded DNA. The temperature to melt-off the hybridization probes from target DNA is not only dependent on length and G+C content, but also on the degree of homology. Hybridization probes, bound to perfectly matching target DNA, require a higher melting temperature (Tm) to separate than hybridization probes bound to DNA containing destabilizing mismatches.
This difference is exploited to detect mutations with the LightCycler System. The hybridization probe covering the region of a potential mutation (mutation probe) has a lower Tm than the adjacent probe (anchor probe), thereby ensuring that the fluorescent signal, generated during the melting curve, is determined only by the mutation probe. Probe/DNA hybrids containing a mismatch melt at lower temperatures than perfectly matched hybrids. This is reflected in different Tm s during melting curve analysis. Hence, wild type, mutant, and mixes thereof (e.g., heterozygous genotype) can be distinguished by differences in their respective melting temperatures (Figure 1).
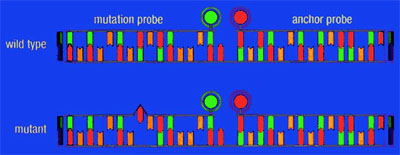
Figure 1: Schematic presentation of a mutation analysis experiment. One hybridization probe, labeled with LightCycler-Red 640, hybridizes to a part of the target sequence that is not mutated and functions as an anchor probe. The other hybridization probe is labeled with fluorescein and spans the mutation site (mutation probe). If a mutation is present, the mismatch of the mutation probe with the target destabilizes the hybrid, allowing it to melt at a lower temperature. With a wild type genotype, mismatches will not occur, and the heteroduplex has a higher Tm. The anchor probe is longer and will therefore still be attached to the target sequence when the mutation probe melts off.
The melting curve analysis is performed immediately after the amplification step. Compared to standard mutation detection methods such as restriction digestion, allele-specific amplification, single-strand conformation polymorphism (SSCP), or heteroduplex analysis, the use of melting curve analysis for the detection of single nucleotide polymorphism (SNP) is rapid and convenient: at a temperature transition rate of 0.1°C/s, approximately five minutes are required for the overall analysis. Manual manipulation, such as removal of sample, pipetting, and gel loading, is eliminated. The LightCycler System also minimizes the risk of contamination: the entire analysis—amplification and mutation detection is performed in a closed system. Once the capillaries are loaded, they remain closed until the presence or absence of a mutation is determined.
The availability of a novel reporter dye and the corresponding color compensation software expands the range of possible applications. Here, we report a genotyping experiment in which two polymorphic sites are interrogated simultaneously in a single capillary on the LightCycler System.
Genotyping—for example, the determination of the presence (or absence) of a mutated gene—allows the identification of those patients at risk of developing debilitating disorders. In some cases, the risk for a certain disorder is associated with a single mutation, as in the case of the factor V Leiden mutation. In other cases, several polymorphic sites may predispose for a disorder. The HFE gene is an example of the latter class of genes. Two polymorphic sites have been observed on the gene: at position Cys287Tyr and His63Asp (Feder et al. 1996). In this case, both mutations lie on separate exons and thus require a multiplex PCR. Other genes are known to have two mutation sites within one exon.
In an effort to demonstrate the multi-color detection utility of the LightCycler System, we have established a model system which allows the simultaneous analysis of two point mutations on the same gene within one amplicon.
Experimental Approach (Back to Top)
In order to study the mutation at position A, a hybridization probe pair was designed in which the 5'- labeled LightCycler-Red 640 (LC-Red 640) probe (19 bases) spans the actual mutation site, and the adjacent fluorescein-labeled probe (25 bases) functions as the anchor probe (Figure 2).
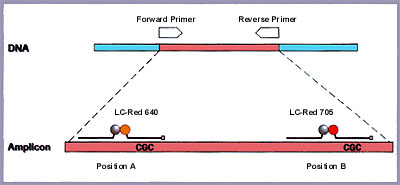
Figure 2: Schematic representation of the gene analyzed. The amplified fragment spans 265 bp. The two sets of hybridization probes are approximately 100 bp apart and are specific for each position. A LightCycler-Red 640 probe is used for the detection of the mutation at position A; a Light-Cycler- Red 705 probe is used for position B. Note that both mutations lie on the same amplicon.
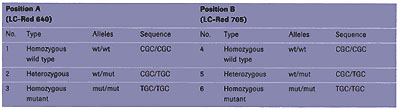
For the analysis of the genotype at position B, the anchor probe (29 bases) is also labeled with fluorescein, whereas the mutation probe (20 bases) is labeled with the novel LightCycler-Red 705 (LC-Red 705) dye. To be able to test all possible mutations, plasmid mixtures were initially used to simulate all possible combinations. As described in Table 1, at each position, A and B, the genotype can either be homozygous wild type, homozygous mutant, or heterozygous. Finally, the experiment was performed on human genomic DNA of known genotype in order to demonstrate the applicability of such an approach in a clinical setting.
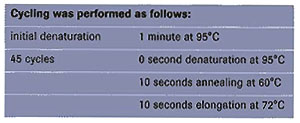
The following conditions applied: PCR was performed in 20 µl using the LightCycler DNA Master hybridization probes, 0.5 µM of each PCR primer, and 0.2 µM of each hybridization probe. Either a total of 1 ng of plasmid DNA or 100 ng of human genomic DNA was used as starting material.
Immediately after the amplification reaction, a melting curve analysis was performed to determine the melting characteristics of the hybridization probes within every sample. After a 30-second denaturation of the PCR products, the sample was cooled down to 42°C and held at this temperature for 2 min. Subsequently, the samples were heated gradually (ramp rate of 0.1°C/s) to 80°C. During this temperature increase, fluorescent signals were measured continuously. Data are displayed immediately on the screen and saved for later analysis.
Results (Back to Top)
The data of the melting curve analysis were analyzed using the LightCycler Software. The fluorescence in channel 2 (for LC-Red 640) was used to monitor the genotype at position A, while channel 3 (for LC-Red 705) was used simultaneously for position B.
In the first experiment, which is depicted in Figure 3, three different plasmid mixtures were utilized as samples. Sample 1 is homozygous wild type at both positions (No. 1 and 4 according to Table 1), sample 2 is heterozygous at positions A and B (No. 2 and 5 according to Table 1), and sample 3 is homozygous mutant at both positions (No. 3 and 6 according to Table 1). Figure 3A shows the raw fluorescence data of the melting curves in Channel 2 (F2). For convenient analysis, the first derivative of these curves is displayed (Figure 3B). The peak represents the T m , in other words, the point at which 50% of the probes have melted off the target DNA.
Using the melting peaks, the genotype at position A is easily determined. The Tm of the LC-Red 640-labeled probe, together with a wild type sequence (red line) is 61.9°C. The high temperature is due to the perfect match between mutation probe and the target sequence. In contrast, the Tm of the mutation probe in the homozygous mutant sample (blue line) is lower (55.5°C), as the mismatch between target DNA and mutation probe destabilizes the binding.
Using Channel 3 (F3), the fluorescent signal of LC-Red 705-labeled probes can be monitored simultaneously in order to determine the genotype at position B (Figure 3D). Transformation of these curves into their first derivative (Figure 3E) reveals that, at this setting, LC-Red-705 cannot be analyzed unambiguously due to the interference of fluorescence signals caused by LC-Red-640, which are also recorded in channel 3. However, by activating the crosstalk compensation file, the F3 signal can be corrected for the contribution of LC-Red-640. Whereas the crosstalk compensation file does not influence the readings of the F2 channel (compare Figures 3B and 3C), the readings in the F3 channel (LC-Red-705) now become apparent (Figure 3F).

Figure 3: Screen shot of melting curve analysis using the advanced multicolor detection software.
To test the utility of such an approach for genetic testing, we subjected human genomic DNA to the multi-color detection of mutations using the LightCycler System. The same conditions as mentioned above were used, and the results are shown in Figure 4. At position A (Figure 4A), the genotype is homozygous mutant. At position B (Figure 4B), the crosstalk-compensated data clearly show two peaks, which are indicative of a heterozygous state. These results are in accordance with data previously obtained using an automatic sequencer.
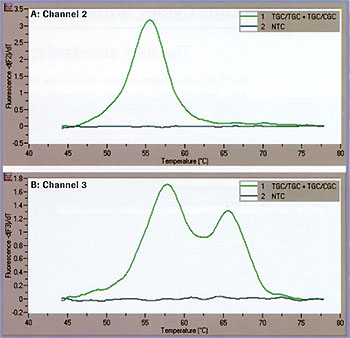
Figure 4: Genotyping experiment on human genomic DNA. A: Channel 2 B: Channel 3.
Discussion (Back to Top)
The use of fluorescent hybridization probes for genotyping is a rapid and sensitive technique that involves minimal sample handling. The method becomes even more time-efficient by allowing several mutations to be analyzed within a single reaction. We have shown that the new reporter dye, in combination with the crosstalk compensation software, allows the simultaneous detection of two mutations within one gene.
The complete analysis (cycling and detection) of the human genomic DNA was completed in 30 minutes, thus demonstrating the usefulness of such a system for rapid genetic testing.
- Wittwer, C.T., Herrmann, M.G., Moss, A.A., and Rasmussen, R.P. (1997) BioTechniques 22:130-138.
- Wittwer, C.T., Ririe, K.M., Andrew, R.V., David, D.A., Gundry, R.A., and Balis, U.J. (1997) BioTechniques 22:176-
181.
- Lay, M.J., and Wittwer, C.T. (1997) Clin. Chem. 43:2262-2267.
- Feder, J.N., Gnirke, A., Thomas, W., Tsuchihashi, Z., Ruddy, D.A., Basava, A., Dormishian, F., Domingo, R. Jr., Ellis, M.C., Fullan, A., Hinton, L.M., Jones N.L., Kimmel, B.E., Kronmal, G.S., Lauer, P., Lee, V.K., Loeb, D.B., Mapa, F.A.,
McClelland, E., Meyer, N.C., Mintier, G.A., Moeller, N., Moore, T., Morikang, E., Wolff, R.K., et al. (1996) Genet. 13(4):399-408.
*University of Freiburg, Department of Clinical Chemistry